Download All Country Data
Unlike many other countries, the United States does not have standard, national data on COVID-19. The US also lacks standards for state-, county- and city- level public reporting of this life-and-death information.
In July 2020, we conducted the first-ever comprehensive review of the status of COVID-19 information in the United States and outlined how states and communities can increase transparency about risk of COVID-19 and accountability for progress through reporting on 15 essential indicators. We released a second comprehensive review, and a model Tableau indicator dashboard, in November of 2020.
In February 2021, we identified six additional indicators for tracking COVID-19 vaccine rollout, and called on states to include this information in public reporting.
Download Resources:
-
Vaccine Indicators and Data Recommendations
English (534.80 KB)
-
Vaccine Indicators Report
(2.51 MB)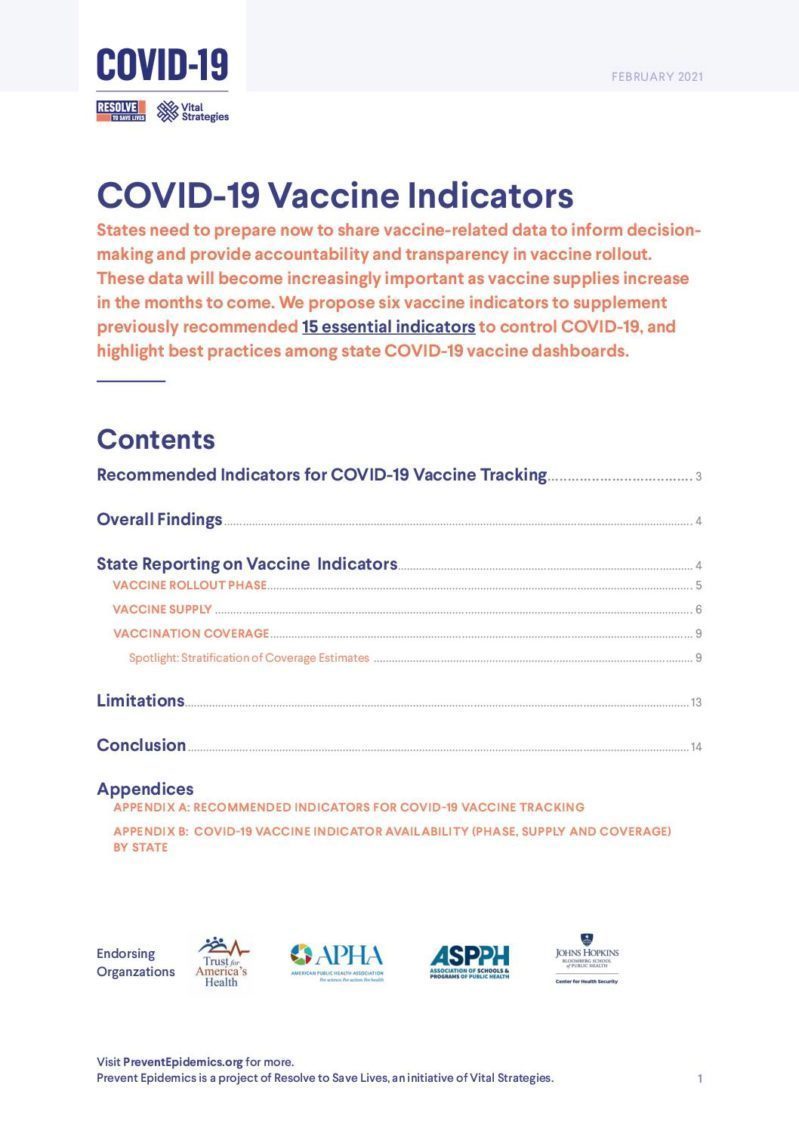
-
Vaccine Indicators: Appendix A
(137.13 KB)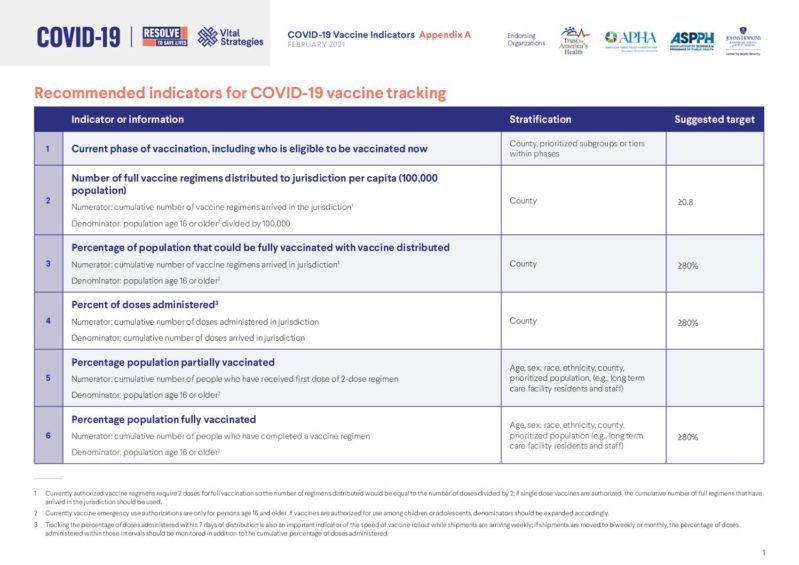
-
Vaccine Indicators: Appendix B
(286.61 KB)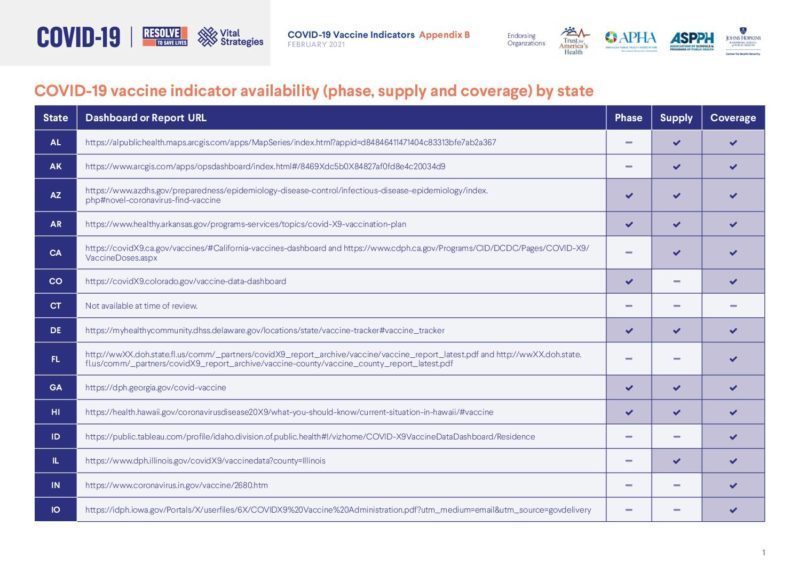
-
Tracking COVID-19 in the United States: Progress and Opportunities
(6.19 MB)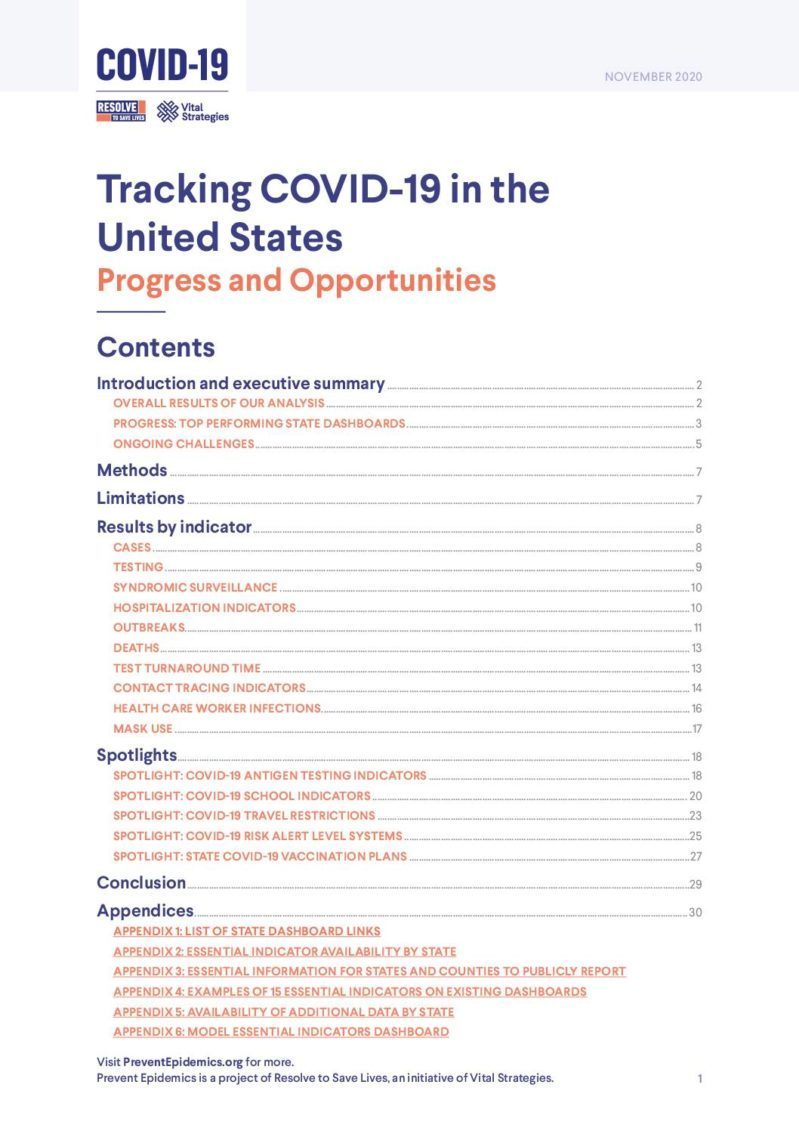
-
COVID-19 Essential Indicators Map
-
Tracking COVID-19 in the United States: Appendix 1
(193.18 KB)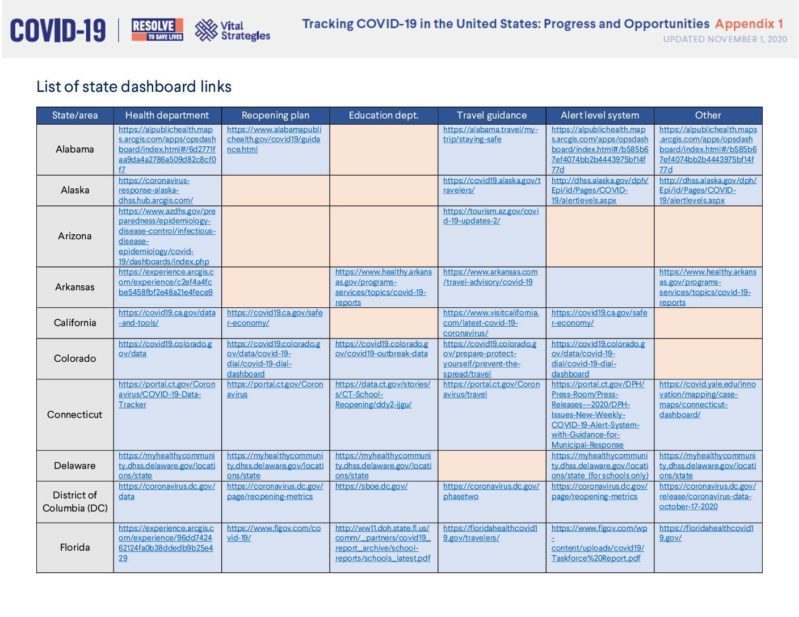
-
Tracking COVID-19 in the United States: Appendix 2
(171.86 KB)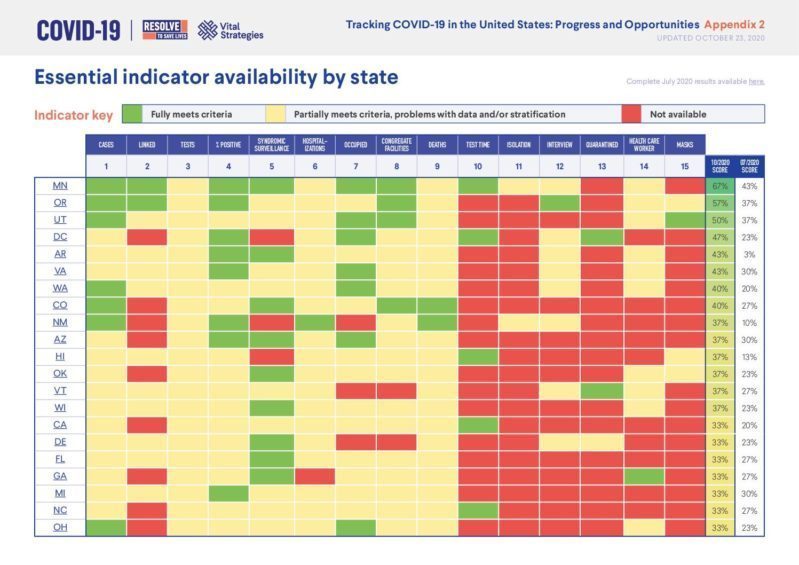
-
Tracking COVID-19 in the United States: Appendix 3
(94.02 KB)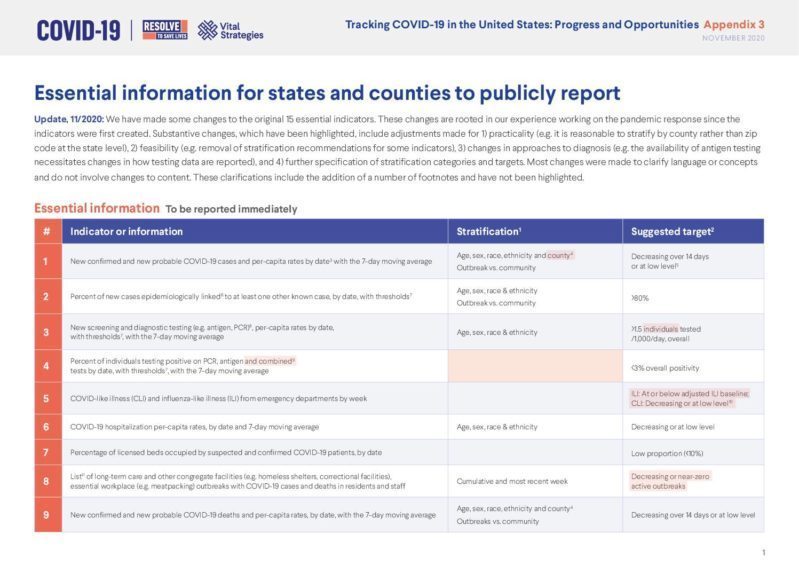
-
Tracking COVID-19 in the United States: Appendix 4
(2.68 MB)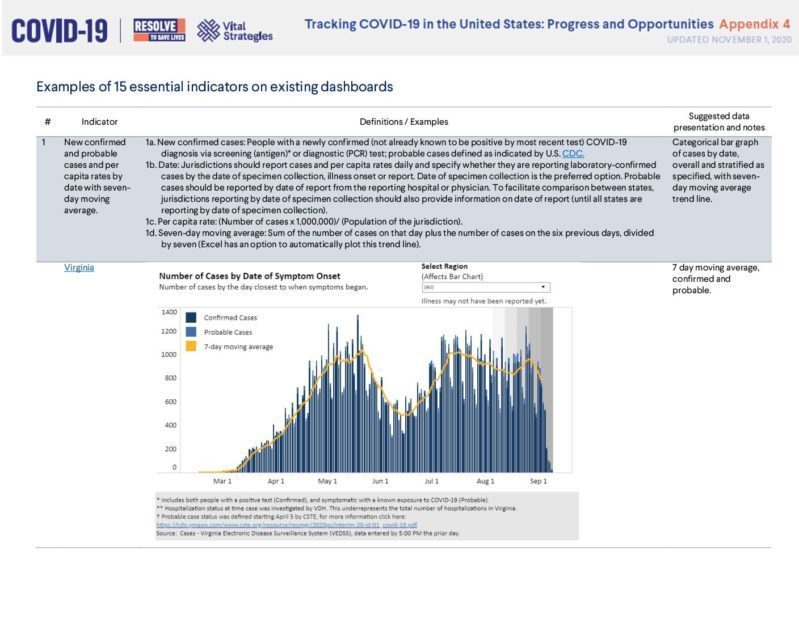
-
Tracking COVID-19 in the United States: Appendix 5
(148.02 KB)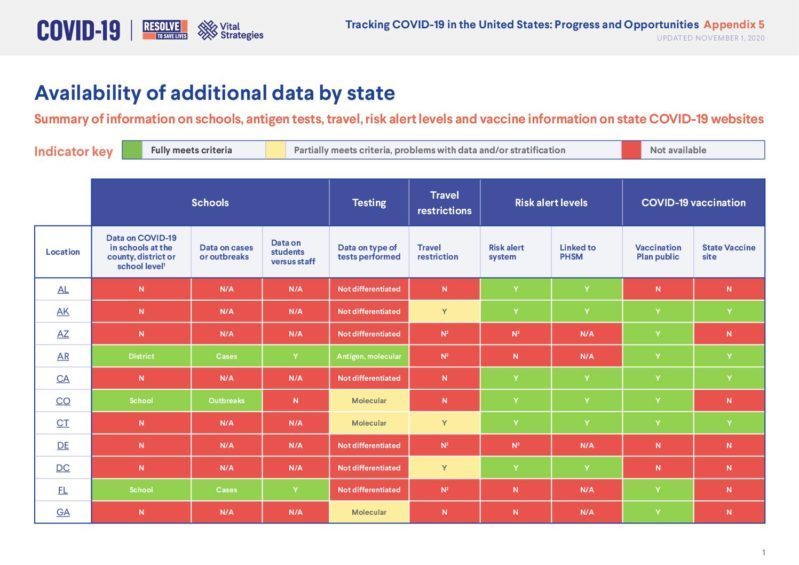
-
Tracking COVID-19 in the United States: Model essential indicators dashboard
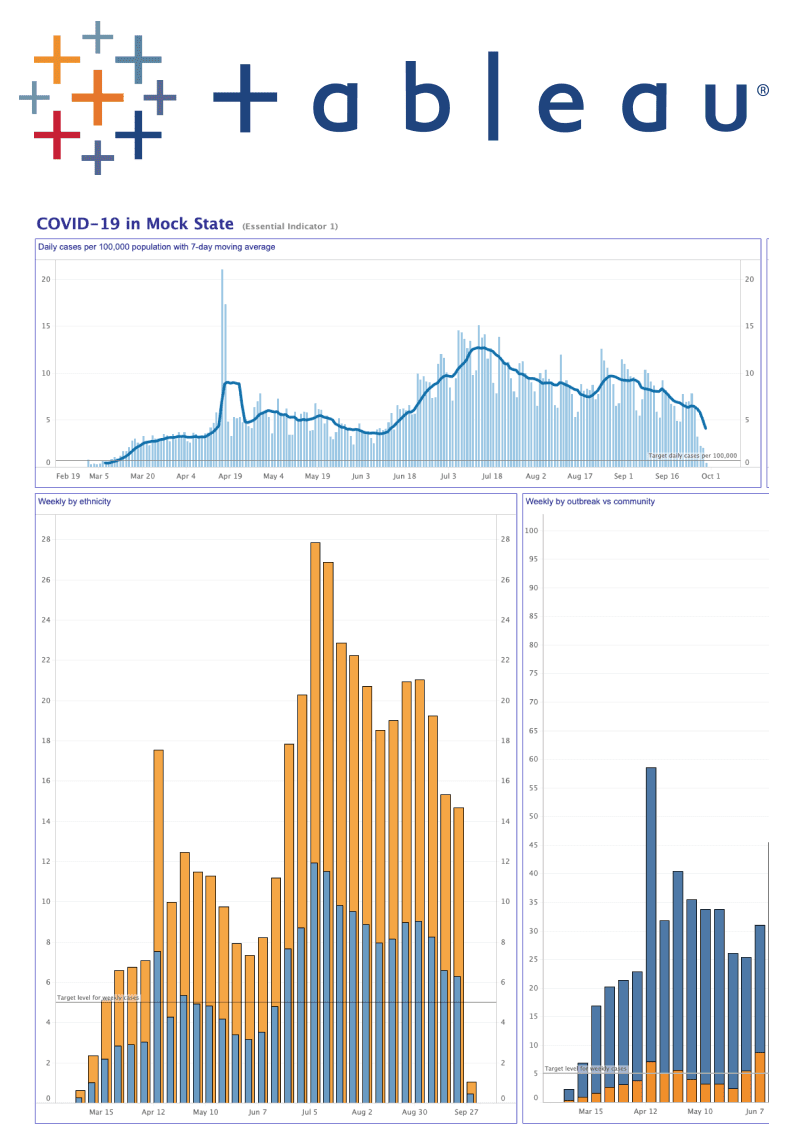
-
Essential Indicators Dashboard Kit
(3.45 MB) -
Press Release: Despite Improvement, Most Essential COVID-19 Data Still Not Available for U.S. States
Essential information
To be reported immediately
| Indicator or information | Stratification1 | Suggested target2 | |
|---|---|---|---|
| 1 | New confirmed and new probable COVID-19 cases and per-capita rates by date3 with the 7-day moving average | Age, sex, race, ethnicity & county4 Outbreak vs. community | Decreasing over 14 days or at low level5 |
| 2 | Percent of new cases epidemiologically linked6 to at least one other known case, by date, with thresholds7 | Age, sex, race & ethnicity Outbreaks vs. community | >80% |
| 3 | New screening and diagnostic testing (e.g. antigen, PCR)8, per-capita rates by date, with thresholds7, with the 7-day moving average | Age, sex, race & ethnicity | >1.5 individuals tested/1,000/day, overall |
| 4 | Percent of individuals testing positive on PCR, antigen and combined9 tests by date, with thresholds7, with the 7-day moving average | <3% overall positivity | |
| 5 | COVID-like illness (CLI) and influenza-like illness (ILI) from emergency departments by week | ILI: At or below adjusted ILI baseline; CLI: Decreasing or at low level10 | |
| 6 | COVID-19 hospitalization per-capita rates, by date and 7-day moving average | Age, sex, race & ethnicity | Decreasing or low level |
| 7 | Percentage of licensed beds occupied by suspected and confirmed COVID-19 patients, by date | Low proportion (<10%) | |
| 8 | List11 of long-term care and other congregate facilities (e.g. homeless shelters, correctional facilities), essential workplace (e.g. meatpacking) outbreaks with COVID-19 cases and deaths in residents and staff | Cumulative and most recent week | Decreasing or near-zero active outbreaks |
| 9 | New confirmed and new probable COVID-19 deaths and per-capita rates, by date, with the 7-day moving average | Age, sex, race, ethnicity & county4 Outbreak vs. community | Decreasing over 14 days or at low level |
| 10 | New | County, prioritized subgroups or tiers within phases | |
| 11 | New | County | ≥0.8 |
| 12 | New | County | ≥80% |
| 13 | New | County | ≥80% |
| 14 | New | Age, sex, race, ethnicity, county, prioritized population | |
| 15 | New | Age, sex, race, ethnicity, county, prioritized population | ≥80% |
Additional essential information
To be reported as soon as possible
| Indicator or information | Stratification1 | Suggested target2 | |
|---|---|---|---|
| 16 | Diagnostic (e.g. PCR) test turnaround time, from specimen collection to test report to the local health department, by week | Age, sex, race & ethnicity, long-term care facility vs. community | >80% within 2 days |
| 17 | Time from specimen collection to isolation of cases, by week. The isolation date is the date of self-reported isolation by the case or issuance of the isolation order, whichever is earlier. | Age, sex, race & ethnicity individual laboratory10, long-term care facility vs. community | >80% within 3 days |
| 18 | Time from case specimen collection to new case interview for contact elicitation, by week of case specimen collection | Age, sex, race & ethnicity individual laboratory10, long-term care facility vs. community | >80% within 3 days |
| 19 | Percentage of new cases from among quarantined contacts, by week of case specimen collection | New cases identified within outbreaks vs. within the community | >50% |
| 20 | New infections among health care workers12, by week | Age, sex, race & ethnicity | 0 |
| 21 | Percentage of people wearing masks correctly in public settings, by week13 | >80% | |
- Reporting of stratified data over time, on a week-by- week basis, is recommended. This allows detection of changes in subgroup impact of the epidemic.
- Unless otherwise stated, targets should be applied for the overall state population and for each subgroup, as reported separately.
- Cases should be reported by date of specimen collection when possible or, if note possible, by date of report or symptom onset. Jurisdictions reporting by date of specimen collection should also provide information on date of report for inter-state comparability, until all states are reporting by date of specimen collection.
- Some states may be divided into geographic areas other than counties. A link to county (or other geographic area) dashboards is recommended.
- Such as below 10 cases per 100,000 population over 2 weeks (CDC), which is equivalent to approximately 0.7 cases per 100,000 per day.
- This refers to epidemiologic links to potential sources of each case’s infection. It does not include individuals potentially infected by the tallied case.
- Thresholds are targets that are used by the state or jurisdiction to denote risk levels or reopening thresholds; there may be multiple thresholds per indicator and they may change over time.
- Both the number of new tests and the number of individuals tested should be reported.
- Some individuals may be tested using more than one test modality on the same day if, for example, two tests make up a single testing algorithm. If this occurs – for example, if a single testing algorithm involves an antigen test and a PCR test – we recommend reporting the test type as “combined.”
- Such as near-zero incidence of CLI (CDC).
- To the extent legally permissible in the state. If there are restrictions on reporting, aggregate numbers should be reported.
- The purpose of this indicator is to track nosocomial infections among health care workers. Therefore, it should exclude infections confirmed to have been contracted outside the health care setting.
- This indicator should be based on direct observation or security camera analysis in settings such as mass transit, shopping malls, etc., by a standard, consistent method. For guidance, refer to the RTSL Mask Guidance Playbook and the accompanying mask-use adherence technical reference.
- Tracking the percentage of doses administered within 7 days of distribution is also an important indicator of the speed of vaccine rollout while shipments are arriving weekly; if shipments are moved to biweekly or monthly, the percentage of doses administered within those intervals should be monitored in addition to the cumulative percentage of doses administered.
Archive: Tracking COVID-19 in the United States: From Information Catastrophe to Empowered Communities, July 2020
-
Tracking COVID-19 in the United States: From information catastrophe to empowered communities
(1.43 MB)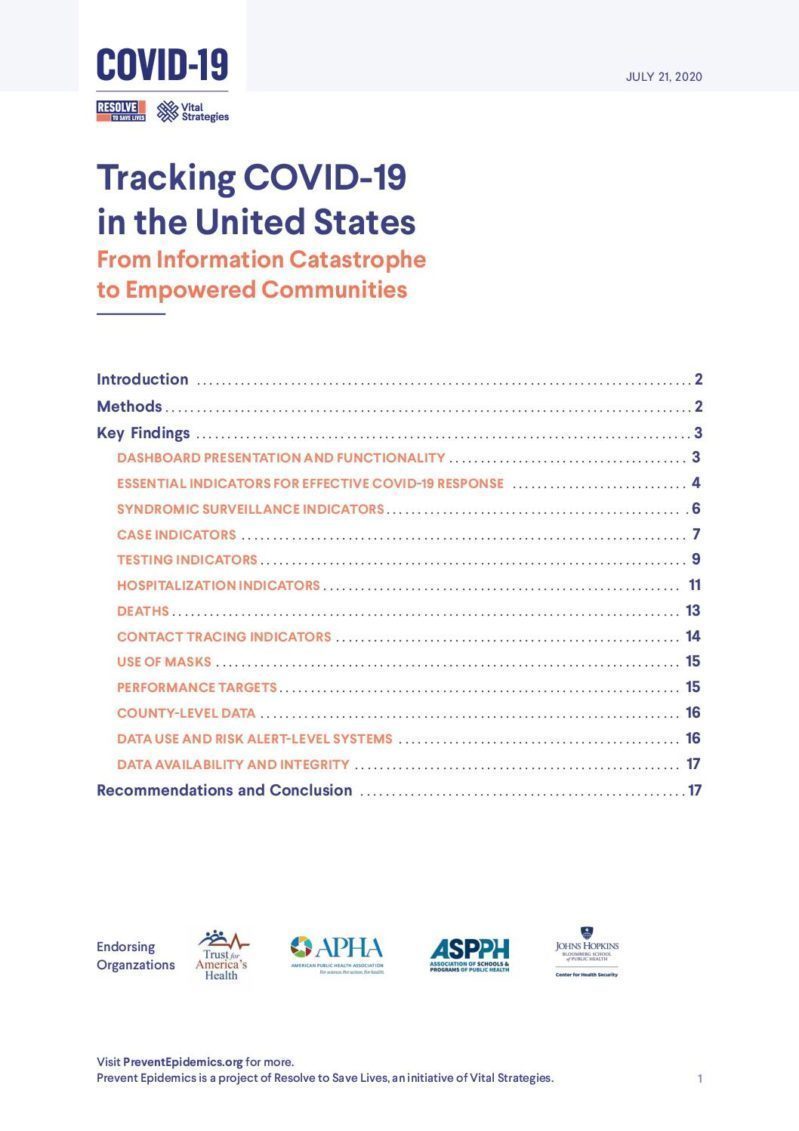
-
Tracking COVID-19 in the United States: Essential indicator availability by state
(332.89 KB)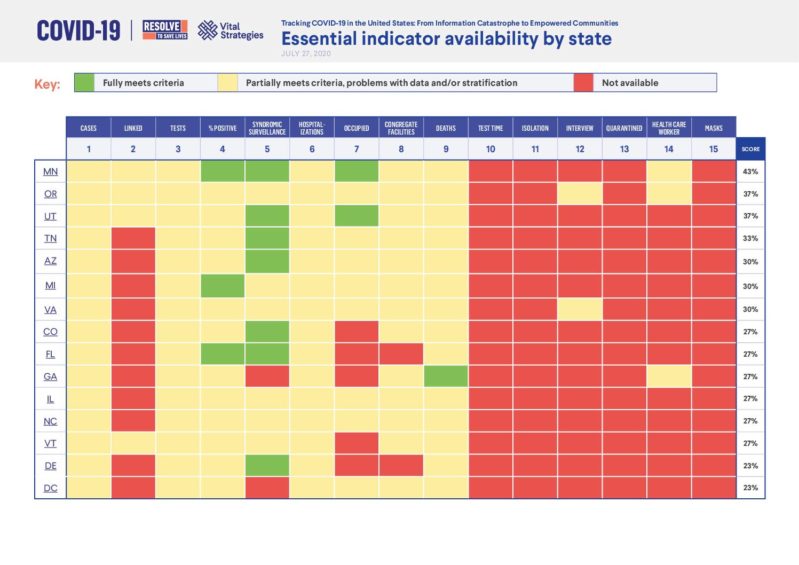
-
COVID-19 Indicators: Essential information for states and countries to publicly report
(237.32 KB)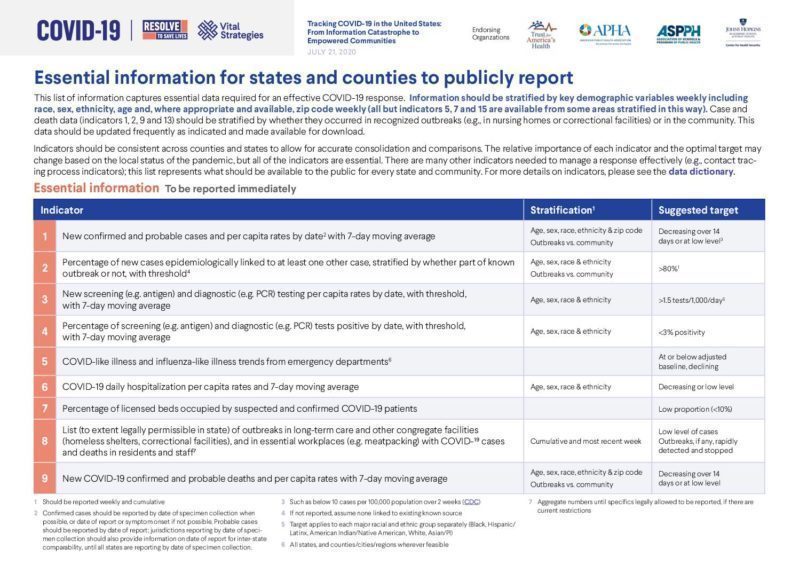
-
COVID-19 Indicators: Example data dashboards
(140.47 KB)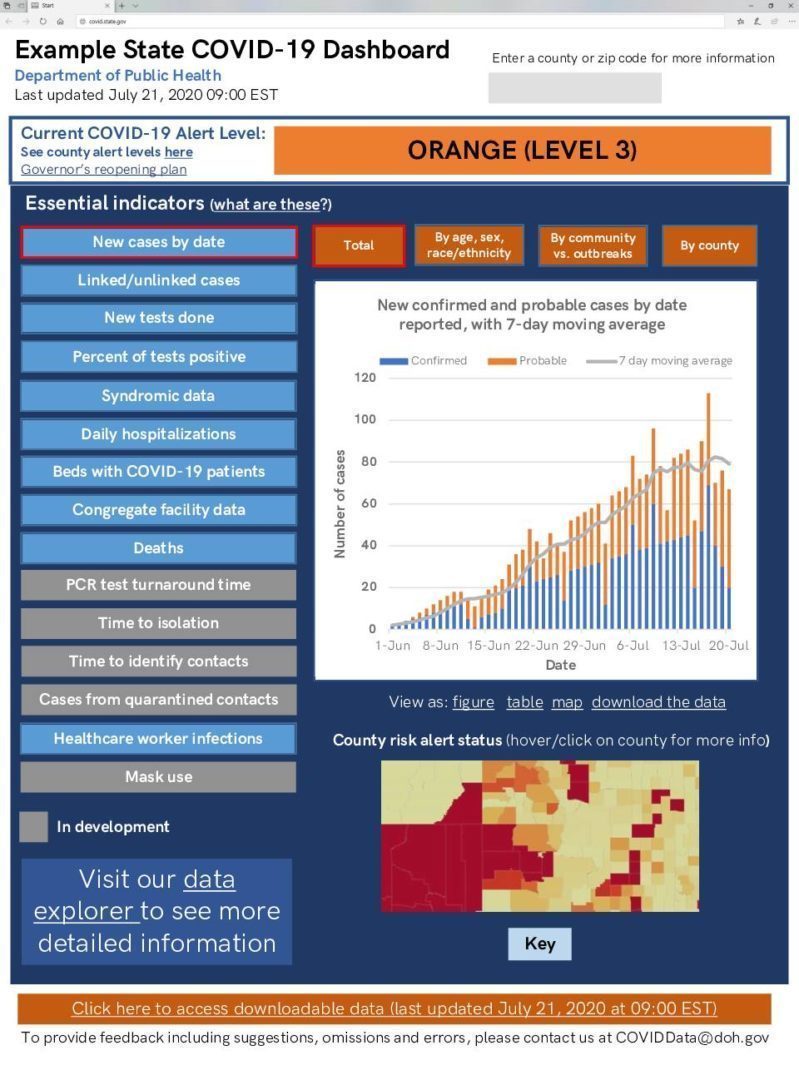
-
Data Dictionary of Essential and Recommended Information for States and Countries to Publicly Report
(180.16 KB)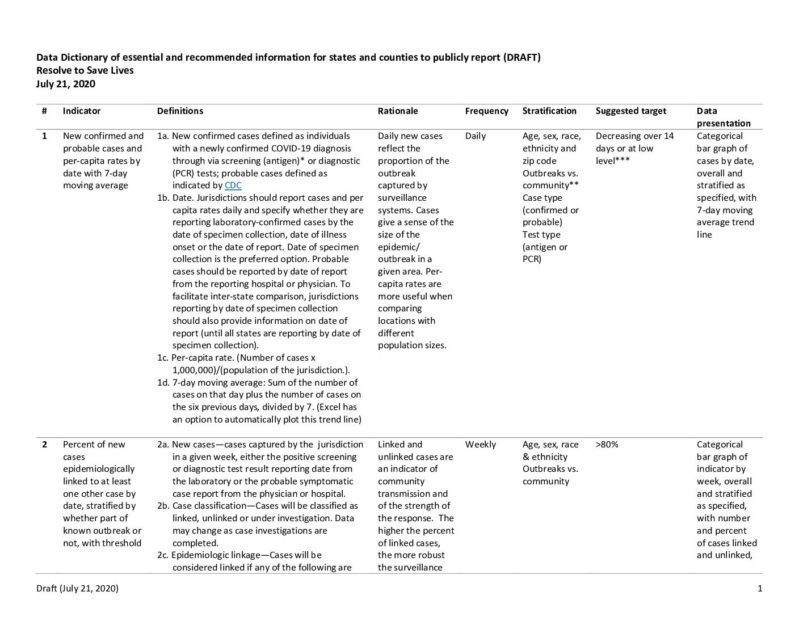
-
Live Essential Indicator Data at Covidexitstrategy.org
-
Press Release: Most of United States Not Reporting Essential COVID-19 Data
-
Briefing Video | Tracking COVID-19 in the United States: From Information Catastrophe to Empowered Communities


