Flu and COVID-19
With the usual influenza season approaching in Northern Hemisphere countries, public health experts are concerned about how strained health systems will manage both flu and COVID-19. If both viruses are circulating in communities, some patients will experience co-infections which may lead to higher rates of severe and fatal disease. But even in the case of more mild illness from either one, the two conditions can be clinically indistinguishable, which will increase testing demands. In addition, many have compared COVID-19 to flu, sometimes inaccurately, adding to the confusion and concern that many people face when they or someone close to them becomes ill. The U.S. Centers for Disease Control and Prevention (CDC) has posted information comparing influenza and COVID-19 which is a useful starting point for making sense of what is known. In this insight, we compiled additional information about how the two conditions affect people.
COVID-19 and flu: Who gets infected and how?
Both COVID-19 and influenza are caused by viruses that spread from person to person in particles released when infected people breathe, cough, sneeze or speak. Those nearby can encounter or inhale these particles or, less commonly, pick them up by touching surfaces where they have landed and then touching their faces. Sustained contact with an infected person at a close distance indoors is much more likely to result in transmission than a brief encounter. We previously shared how researchers are still learning more about the dynamics of how viruses move through the air, how long they can stay suspended, how far they travel, how many virus particles are released at a time in different situations, and how long they can remain infectious in the air or on a surface. All of these things affect how easily the infection will spread. It is likely that these properties will differ in small ways between influenza viruses and SARS-Co-V-2, the virus that causes COVID-19. In either case, transmission risk increases the longer and more closely people interact, especially in confined, poorly ventilated spaces.
The viruses that cause flu and COVID-19 are also biologically distinct in how they are able to initiate infection. Glycoproteins on influenza viruses can bind to sialic acid sugars on the surface of cells in the respiratory tract. SARS-CoV-2 is covered in spike proteins that recognize specific features (called angiotensin-converting enzyme-2 or ACE-2 receptors) on cells lining the lungs, intestines, blood vessels and perhaps other tissues. Once infection is established, the viruses differ in terms of how efficiently they replicate and the sorts of immune responses they elicit. Taken together these factors also help shape the risk of developing clinical illness as well as the timing and duration of viral shedding, which drives the potential for further transmission. Once infected with influenza virus, most people who develop symptoms do so within one to four days. On average, symptoms of COVID-19 usually appear five days after infection, but this can range from as little as two to as many as fourteen days. People infected with either virus can spread the infection a day or two before they develop symptoms, but people with COVID-19 are usually contagious for a longer period of time than those with flu. Most people with influenza shed enough virus to infect others for about seven days from the time their illness starts and are most likely to transmit in the first few days of their illness. A COVID-19 patient may be most infectious during the days just before and immediately after their symptoms develop and can infect others for at least 10 days after becoming ill. It is important to remember that both influenza and SARS-CoV-2 viruses can be transmitted by asymptomatic people who are infected but are not ill; some develop symptoms later (sometimes distinguished as presymptomatic) but others never do. Researchers estimate that people without symptoms may account for 25-30% of all flu transmission and possibly half or more of COVID-19 transmission.
Some of these differences can have a large impact on how epidemics unfold. The best information available to date strongly suggests that SARS-CoV-2 is more infectious than influenza. One comparative measure of this, the basic reproduction number (R0), can be summarized as the average number of additional cases each newly affected person is likely to pass the disease on to, assuming no effective control measures are in place. For seasonal influenza R0 is typically less than 1.5. This number can be higher, between 1.5 and 2.0, for novel and pandemic influenza. For COVID-19 R0 is estimated to be 2.5 or more, substantially higher than for flu. The difference can help explain how COVID-19 spread so rapidly in many parts of the world, especially before public health and social measures were put in place. It is important to note that R0 is an average estimated value; some people don’t infect any other people, while some may transmit the virus to dozens of others in so-called superspreader events, which appear to be more common with COVID-19 than influenza.
People of all ages can get infected and develop mild or severe illness from both influenza and COVID-19, but there are important differences. Older adults, particularly men, and people with underlying conditions, are most at risk of severe and complicated COVID-19, which may result in them being infectious for a longer period of time. On the other hand, children can easily acquire and transmit flu viruses; in many influenza outbreaks, children are major drivers of transmission. Because they haven’t been exposed to as many related viruses in previous flu seasons, children can be more susceptible to influenza and may be infectious longer than adults. In an earlier Weekly Science Review, we described what is known about COVID-19 transmission in children. In multiple countries, fewer cases have been reported among children than adults, but it is not clear how much this is because children are both less susceptible and more likely to have a mild or asymptomatic infection that goes undetected. Even young children can transmit SARS-CoV-2 to other close contacts, but unlike with flu, young children appear to be less likely to do so than infected adults. Young children do not appear to be major drivers of COVID-19 transmission.
In addition to the biological characteristics of the viruses and the people infected, other factors affect the transmission of both influenza and SARS-CoV-2 viruses. Cold temperatures and low humidity can improve the efficiency of transmission for both viruses. These conditions may also increase the likelihood that people congregate in poorly ventilated indoor spaces, which also favor transmission. As a result, influenza viruses tend to circulate in a seasonal pattern, at least in temperate parts of the world. This phenomenon is also driven by the accumulated immunity in a population and the cyclic evolution of new subtypes of the influenza viruses. When a sufficiently novel or pandemic strain of flu occurs, transmission may be widespread even outside the expected seasonal period. Something similar appears to be occurring with the novel coronavirus that causes COVID-19. It has spread rapidly, even during warm seasons and in tropical climates, because people everywhere are almost universally susceptible to infection. Finally, people’s behavior can also have an impact on transmission of both influenza and COVID-19. In a previous Weekly Science Review we reported on how little recent influenza activity has been documented in temperate parts of the Southern Hemisphere, where the seasonal transmission typically peaks during August but shows no sign of having started this year. Because both viruses are transmitted in similar ways, many of the precautions in place for COVID-19 may help limit the impact of the coming flu season, especially if many people also take advantage of the influenza vaccine.

Figure: Relative proportion of infected people with asymptomatic infection, mild to moderate illness, and illness requiring hospitalization for seasonal influenza and COVID-19. Based on the 2018-19 influenza season and current best estimates from COVID-19 scenario planning, U.S. Centers for Disease Control and Prevention.
General clinical features of flu and COVID-19
Most people who become ill with flu or COVID-19 have mild symptoms and do not require hospitalization. Most people with mild flu symptoms recover within a week. Most people with mild COVID-19 symptoms recover within two weeks, although there are reports of some people with COVID-19 experiencing lingering symptoms. Both influenza and SARS-CoV-2 infections typically start in the respiratory tract and thus cause symptoms such as cough, difficulty breathing or shortness of breath; fever is also a common manifestation of both infections. In addition to respiratory symptoms and fever, both infections can cause a range of other symptoms affecting different parts of the body. This overlap and non-specificity of symptoms caused by influenza, SARS-CoV-2 and other respiratory infections makes definitive diagnosis impossible based on signs and symptoms alone. However, certain clinical characteristics such as a new smell disorder (anosmia) or a new taste disorder (hypogeusia or dysgeusia) have been shown to be more common among COVID-19 patients. This is reflected in some clinical criteria used to identify cases of COVID-19.
Both influenza viruses and SARS-CoV-2 commonly cause asymptomatic infections. Estimates of the percentage of influenza infections that are asymptomatic range widely from 4% to 85% depending on the population studied and the methods used; a commonly cited approximation is that 50% of influenza infections are asymptomatic. For SARS-CoV-2, currently available studies suggest that anywhere between 5% and 80% of SARS-COV-2 infections may be asymptomatic, with the most recent CDC best estimate being 40% of all infections are asymptomatic, and this proportion varying widely depending on the age distribution of the population. Data are continuing to emerge as more antibody and PCR testing of asymptomatic individuals is conducted.
Although most influenza and SARS-CoV-2 infections are asymptomatic or mild, both viruses can cause more severe symptoms that may require additional care or take longer to resolve. Some of the more common complications of the flu include sinus and ear infections, but many parts of the body, including vital organs such as the heart and brain, can be affected. Among COVID-19 patients, damage to many different organs has been reported. As above, influenza viruses infect cells found predominantly in the upper respiratory tract, whereas SARS-CoV-2 attaches to receptors on cells found throughout the respiratory tract, including deep in the lungs, as well as in a number of other organs.
Severe flu and COVID-19
The severity of an infection depends in part on host factors (characteristics of the patient). One of these factors is a patient’s baseline health. Certain underlying conditions increase the risk of severe influenza but there is no consensus on which underlying conditions confer what degree of risk of hospitalization or death. For COVID-19, the list of medical conditions that may predispose to severe disease has been refined as data have emerged. According to the CDC, currently available data from 10,432 hospitalized adults with information on underlying medical conditions shows that 91% had at least one reported underlying medical condition. Older age is strongly associated with hospitalization and death among both flu and COVID-19 patients.
Another factor that influences the severity of infection is the patient’s immunologic response. The relative immunodeficiency associated with aging may increase the risk of severe flu or COVID-19 among older age groups. On the other hand, the immunologic memory generated by previous exposure to a pathogen, whether through natural infection exposure or vaccination, can decrease the risk of severe disease when an infection occurs. Some people get the flu even after they have been vaccinated, but among those people, the risk of hospitalization, admission to the intensive care unit, and death may be lower. Although the subtypes of circulating influenza virus change each year, the immunologic memory generated by natural exposure or vaccination during a previous season can confer some level of protection against other subtypes. This is one reason why younger children experience higher rates of symptomatic flu infection and require hospitalization more than healthy adults, as shown in the chart below. As we previously wrote, it is not yet clear whether people who are infected with SARS-CoV-2 after prior immunologic exposure are less likely to develop severe COVID-19.
Comparing the severity of flu and COVID-19
Hospitalizations and mortality per population
Hospitalization and mortality data for flu and COVID-19 can give some indication of relative disease severity. The following chart shows approximate rates of hospitalizations and deaths in the U.S. by age group. Data include CDC estimates of influenza-associated hospitalizations and deaths from the 2018-19 season, COVID-19 hospitalizations reported by participating counties to the COVID-19-Associated Hospitalization Surveillance Network through September 12, 2020, and COVID-19 deaths reported to the National Center for Health Statistics by September 16, 2020.
| Hospitalizations per 100,000 population | Deaths per 100,000 population | |||
|---|---|---|---|---|
| Age group | Influenza | COVID-19 | Influenza | COVID-19 |
| 0-4 years | 128 | 17 | 1 | 0 |
| 5-17 years | 39 | 10 | 0 | 0 (ages 5-14) |
| 18-49 years | 48 | 116 | 2 | 9 (ages 15-54) |
| 50-64 years | 155 | 255 | 9 | 55 (ages 55-64) |
| 65+ years | 533 | 461 | 49 | 274 |
The rate of hospitalization and death from both diseases increased with age. However the proportional increase in deaths versus hospitalizations was not equivalent between the two diseases. Among people aged 65 and older, there was one death per 10.8 patients hospitalized with flu while there was one death per 1.6 patients hospitalized with COVID-19. The death-to-hospitalization ratio among older COVID-19 patients is striking and belies the increased fatality rate in that age group.
Although it is tempting to draw conclusions about the relative burden of influenza and COVID-19 from this chart, there are a number of caveats to consider. First, patterns of hospitalization among flu versus COVID-19 patients may differ because there have been limited treatment options for COVID-19 patients and because of limitations in health care system capacity during the COVID-19 pandemic. Second, a significant number of deaths due to COVID-19 may have gone undetected during this pandemic. Third, there are delays in documenting and reporting deaths due to COVID-19. Fourth, there are differences in the way that COVID-19 and influenza data are reported that make comparisons problematic. The influenza statistics presented by CDC are estimates because directly reported numbers undercount the actual burden of flu. This is in contrast with COVID-19 statistics, which are directly reported. Lastly, flu burden estimates are from entire calendar years, whereas COVID-19 statistics are from the limited timeline during which cases have been recognized and reported.
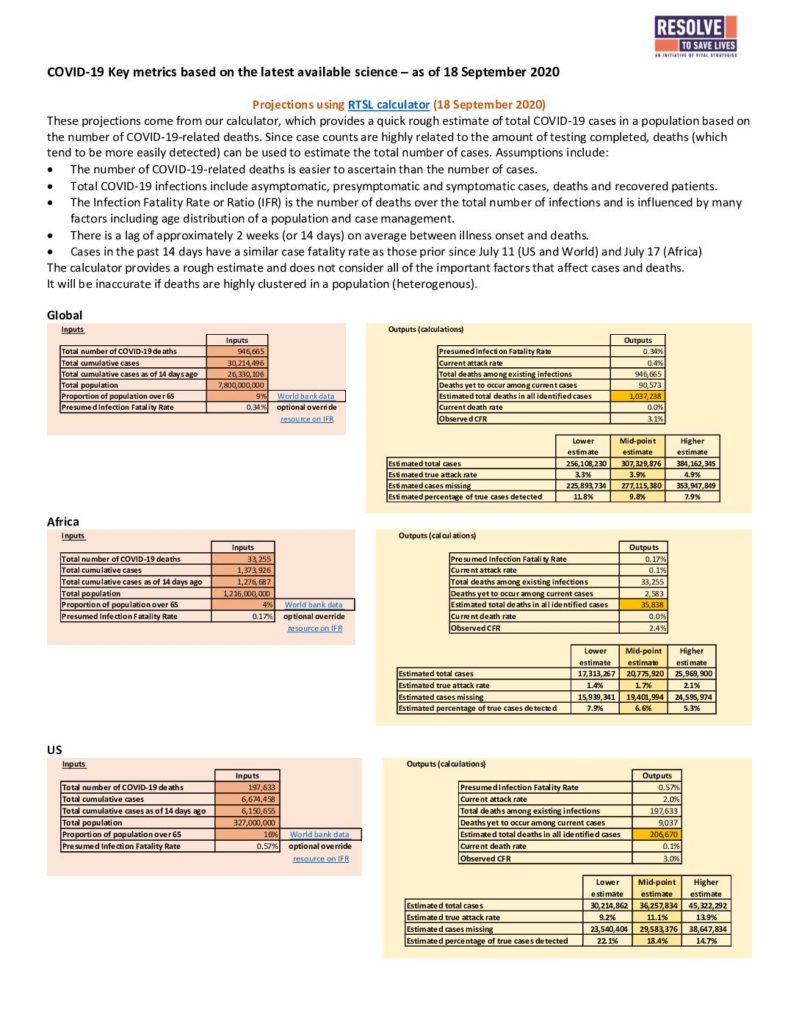
Infection-associated mortality risk – Another way to compare the severity of one infection to another is to examine the mortality risk associated with infection. In essence, the question that is being answered is: If someone is infected, how likely is that person to die? The likelihood of death is often represented as the case fatality rate (CFR):
CFR = the number of people who have died/the number of people diagnosed with the disease.
So if 10 people have died, and 100 people have been diagnosed with the disease, the CFR is (10/100) or 10%. Several problems with the CFR exist. First, if there are people who have been diagnosed with a disease but the disease has yet to run its full course (and death may yet occur), the CFR can underestimate disease lethality. Second, the denominator includes only diagnosed cases. During the COVID-19 pandemic, a significant proportion of cases have gone undiagnosed, and thus the CFR may overestimate disease lethality. A more accurate measure of mortality risk is the infection fatality rate (IFR):
IFR = the number of people who have died/the number of people who have had the disease.
In the above example where the CFR is 10%, if only half of the cases have been diagnosed and there are actually 200 cases, then the real risk of death per case (the IFR) is 5%. It can be challenging to determine the IFR because the total number of cases must be included in the calculation. In order to calculate the IFR, potentially undiagnosed cases must be sought and/or estimated. This is why, for both flu and COVID-19, IFR calculations use data from studies that have conducted population-wide antibody testing and/or PCR screening of asymptomatic people. Neither the CFR nor the IFR is a biological constant. Mortality risk is influenced by many factors, including the quality of available medical care and characteristics of the patient population. In addition, the CFR is greatly influenced by local diagnostic testing capacity, how cases are defined, criteria for testing, and test-seeking behavior of the population. Therefore COVID-19 CFRs have fluctuated as the pandemic has evolved.
In the chart below, COVID-19 case and death data from China, Italy and the U.S. has been used to estimate age-specific CFRs. Estimates of COVID-19 IFRs are from a pre-print study that combined age-specific COVID-19 death data from 45 countries with data from 15 seroprevalence surveys to infer age-specific IFRs. The IFR estimates in the chart show similar age-specific trends to IFR estimates from CDC.
| Age | COVID-19 CFR | COVID-19 Consensus CFR | COVID-19 IFR |
|---|---|---|---|
| 0-9 | China=0% Italy=0% US=0.1% | 0-0.1% | 0% |
| 10-19 | China=0.2% Italy 0% US=0.1% | 0-0.1% | 0% |
| 20-29 | China=0.2% Italy=0% US=0.1% | 0.1-0.2% | 0% |
| 30-39 | China=0.2% Italy=0.3% US=0.4% | 0.2-0.4% | 0% |
| 40-49 | China=0.4% Italy=0.4% US (45-54)=1.0% | 0.3-1.0% | 0.1% |
| 50-59 | China=1.3% Italy=1% US=2.4% | 0.4%-2.4% | 0.2% |
| 60-69 | China=3.6% Italy=3.5% US=6.7% | 1.8%-6.7% | 0.4% – 0.6% |
| 70-79 | China=8% Italy=12.8% US=16.6% | 4.8%-16.6% | 1.1% – 2.3% |
| 80-89 or 80+ | China=14.8% Italy=20.2% US=28.7% | 7.8%-28.7% | 7.3% |
Using CDC estimates of infections and deaths from the 2018-19 influenza season to calculate age-specific CFRs for the flu, it appears that the flu is far less deadly than COVID-19, especially among older age groups (age 0-49 CFR = 0%; age 50-64 CFR = 0.1%; age 65+ CFR = 0.9%).
However, these comparisons are problematic for some of the reasons discussed above, including the way data is estimated versus reported and case detection during a pandemic of a novel virus. As COVID-19 serologic data becomes increasingly available, mortality risk estimates may change. One example of this is a recent study from Iceland that demonstrates how serosurveillance data can inform mortality risk calculations.
Genetic structure and implications for acquired protective immunity and vaccines
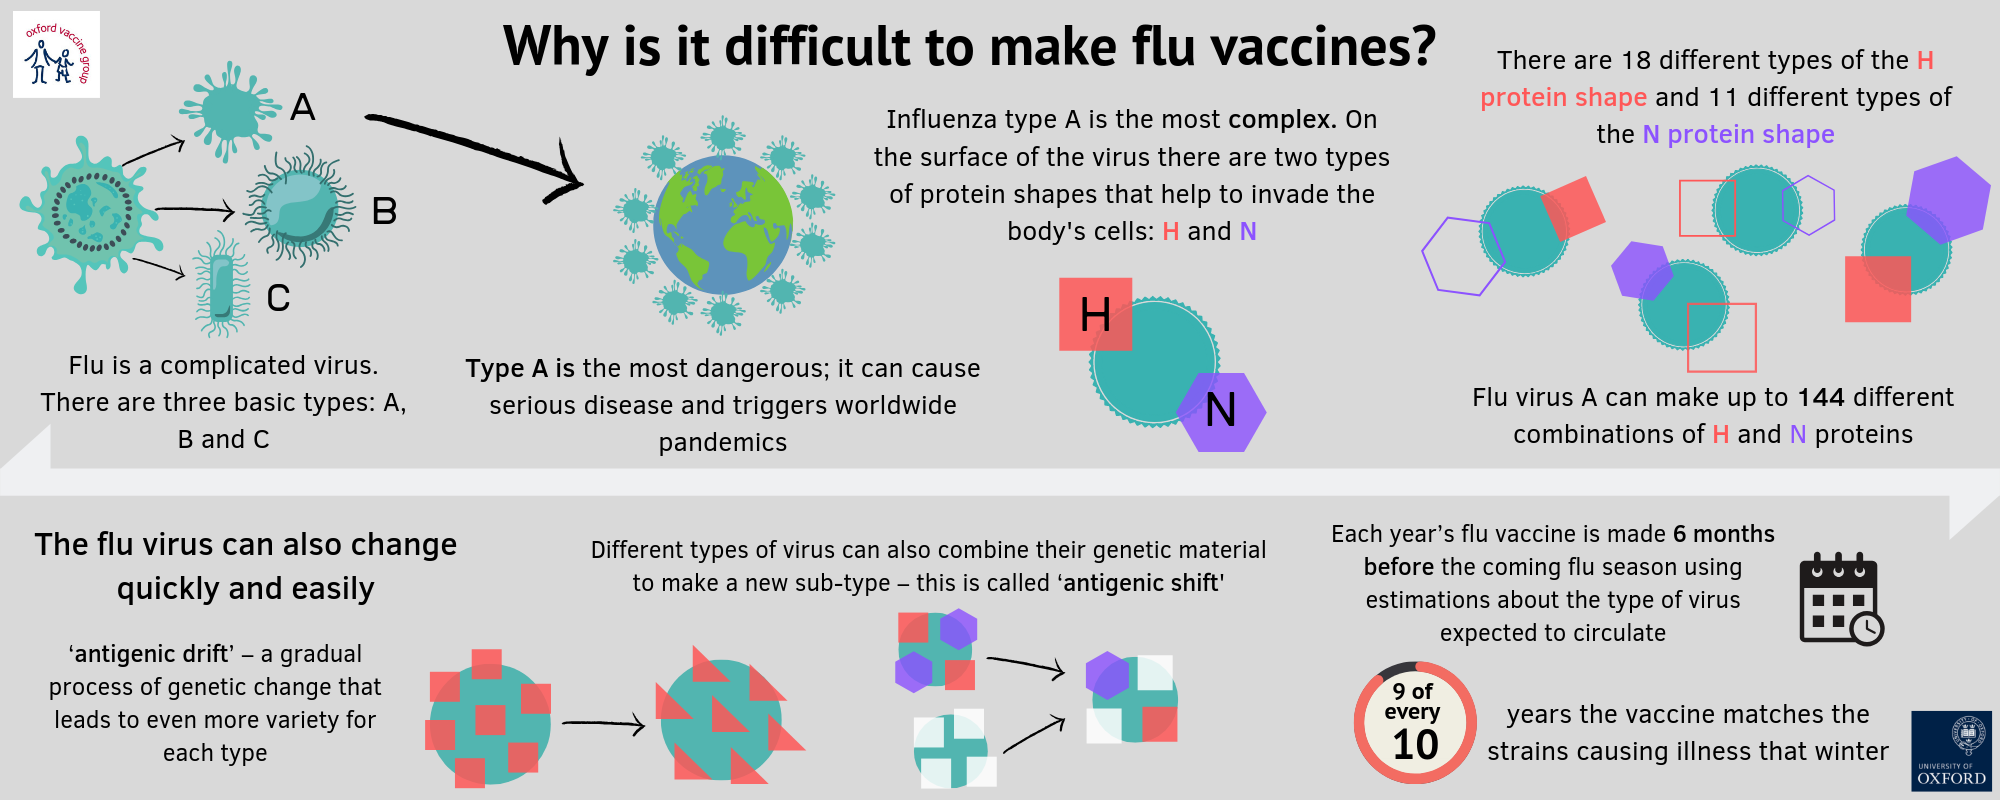
Although the influenza virus and SARS-CoV-2 are both RNA viruses, their structural differences result in major implications for long-lasting acquired immunity from infection as well as immunity from a vaccine. The influenza virus has segments of genetic material that each code for a number of proteins. The number of segments and proteins varies slightly among different virus types (e.g. A vs. B). Mutations, drift, shifts, swapping or rearrangements in these segments can result in a virus that behaves differently and requires different vaccine types. This also means that it affects the way the body’s existing memory of a prior flu infection interacts with an infection from a virus that has different segments or arrangements. Currently, the target of the vaccine for the seasonal influenza that is available each fall is based on a segment and protein that changes depending on which type, subtype or lineage is expected to circulate. Therefore, each year, scientists and public health professionals have to anticipate which of the many known virus strains to include in the vaccine. While some parts of the virus that are integral to its ability to infect hosts change often, other parts remain essentially the same. These stable portions of the virus are the subject of ongoing research to develop a universal influenza vaccine: a single vaccine that would protect against all strains for a long time.
Source: Oxford Vaccine Group
SARS-CoV-2, on the other hand is a single strand of genetic material with proteins being coded for in different regions. It is a relatively large RNA virus, and although it is mutating at a rate consistent with most RNA viruses, these mutations may not result in the same type of dramatic changes that are seen in circulating influenza viruses year after year. Currently, almost 200 different vaccines are in some stage of investigation in laboratories, animals or humans. Candidate vaccines for COVID-19 were discussed in detail in a previous Weekly Science Review. Since it is a novel coronavirus, much less is known about how it will behave over time.
For seasonal influenza, a vaccine is available every year targeting the most likely circulating viruses. Another goal for newer vaccines being studied is to lengthen the duration of protection that they offer. The existing vaccines produce short-term protection from infection which typically fades after six months. This short-term nature of protection is another reason influenza vaccines currently need to be given each year. The level of protection they offer can vary based on a number of factors, including if the circulating strains are included in the vaccine, and different aspects of the manufacturing process. In contrast, natural infection with influenza may result in protective immunity that lasts much longer–50 years or more, and infection with one strain of virus may help in part with protection from others.
Much less is known about how long a potential COVID-19 vaccine can offer protection. Protection after natural infection has not yet been directly studied or confirmed, though surrogates such as antibody levels (immune responses rather than immunity itself) after infection suggest that in at least some people it would likely last at least several months. There have already been reports of reinfection.
With all of these nuances, concerns and complexities, it is important to emphasize that for tens of thousands of people each year, the seasonal influenza vaccine prevents infection, reduces severity of illness and saves lives. With adequate study of efficacy and safety, a vaccine for COVID-19 may soon offer populations similar benefits.
Treating the flu and COVID-19
Whereas vaccines to prevent disease have benefits at a population and individual level, therapies and treatment are still important for individual patients. Both the flu and COVID-19 are viral illnesses that can progress to pneumonia, severe respiratory illness and a variety of other manifestations. The principal treatment for such viral illnesses is typically supportive care as the body fights the infection. Supportive care can include anything from hydration to medications that reduce fever to mechanical ventilation to maintain oxygen levels. As far as directly treating the infection, antiviral drugs can be used in some cases. For influenza, these can include one of four FDA-approved medications shown to be effective in clinical studies (the most common being oseltamivir, brand name Tamiflu). Some of these antivirals, which stop or slow the growth of the virus in the body, are given as pills, whereas others need to be administered by a doctor through an IV or taken as an inhaler. Dosing regimens also vary and each is approved for different age groups. When given early after onset of symptoms, they can lessen the severity of illness, prevent complications such as pneumonia and help reduce the duration of illness from influenza.
Currently, one antiviral named remdesivir has been given emergency use authorization for use in COVID-19 patients after studies showed that it appeared to shorten time to recovery in adults hospitalized with the illness. Another therapy that has been authorized for emergency use in the U.S. is convalescent plasma, described here in a previous Weekly Science Review, although there is greater uncertainty around its true efficacy and indications for use. There has also recently been growing evidence supporting the use of dexamethasone and other steroid medications in more severely ill patients whose immune responses to infection may overreact or act inappropriately causing critical illness. Research into treatments for both the flu, COVID-19 and their sequelae are ongoing.
Weekly Research Highlights
Community and Close Contact Exposures Associated with COVID-19 Among Symptomatic Adults >18 Years in 11 Outpatient Health Care Facilities — United States, July 2020
(MMWR, September 11)
- Researchers contacted adults, aged 18 years and older, the day after they presented for their first COVID-19 test between July 1 and 29, 2020 at 11 U.S. sites participating in a clinical research network. Eligible participants had one or more COVID-19 symptoms on the day of their test; there were 154 case-patients who tested positive for SARS-CoV-2, the virus that causes COVID-19, and 160 control participants who tested negative. Control participants were recruited from the same sites as case-patients. All participants were interviewed by telephone to assess their history of close contact with someone known to have COVID-19, as well as workplace exposure, mask use and possible community exposure activities.
- 42% of case-patients reported having had close contact with someone known to have COVID-19, compared to only 14% of control participants. Case-patients were also more likely to have reported dining at a restaurant (aOR = 2.4, 95% CI = 1.5–3.8). Among the 225 participants who did not report recent close contact with a person with known COVID-19, case-patients were more likely than controls to report dining at a restaurant (aOR = 2.8, 95% CI = 1.9–4.3) or going to a bar or coffee shop (aOR = 3.9, 95% CI = 1.5–10.1). No significant differences were observed between case patients’ and control participants’ histories of attending an in-home gathering with more than 10 persons, using public transportation, shopping, or going to an office, salon, gym or religious gathering.
- In this study, eating and drinking in restaurants and bars was more common among patients with COVID-19 than among participants who tested negative. The study was limited to a small number of participants recruited from just 11 clinics; the results may not be typical of the whole U.S. population. In addition, participants were interviewed after they knew their test results, which could affect how they recalled potential exposures. It is also possible that some unmeasured exposure could have accounted for the differences seen. The authors conclude that eating and drinking on-site in restaurants and bars may be an important risk factor for infection with SARS-CoV-2, and recommend measures to reduce exposure.
Demographic Differences in US Adult Intentions to Receive a Potential Coronavirus Vaccine and Implications for Ongoing Study
(Preprint, September 9)
- The author used data from the May 14-18, 2020, Associated Press-NORC Center for Public Affairs Research poll. In that poll, a representative sample of the U.S. household population was selected using probability-based methods among adults ages 18 and older living in the 50 states and the District of Columbia. Respondents completed web- and phone-based surveys in English and Spanish, including questions on socioeconomic, demographic and geographic factors, on whether or not the respondent intended to receive a COVID-19 vaccine and, if yes, why (focusing on five potential rationales). The analytic sample consisted of 1,000 respondents who provided complete information for all study variables.
- 50% of respondents reported intention to get a vaccine, 20% reported no intention to get a vaccine and 30% were unsure. Rationales for vaccination among those with intention to vaccinate were self-protection (93%), protection of family or community (89% and 78% respectively), a doctor’s recommendation (45%), and presence of a chronic health condition (36%).
- Respondents who were less likely to report intention to vaccinate included: those with household incomes of less than $30,000 (versus at least $100,000); those who identified as African American (versus white); those who were younger (versus those 60 years or older); and those with somewhat or very conservative political beliefs (versus those with liberal political beliefs). Factors associated with reporting “unsure” versus “no” were high school versus college education and having moderate versus liberal political beliefs.
- Limitations include the timing of data collection (mid-May; information about potential COVID-19 vaccines has evolved since then), the hypothetical nature of the survey given current lack of vaccine availability, and the failure to examine reasons for vaccine refusal.
Decreased Influenza Activity During the COVID-19 Pandemic — United States, Australia, Chile, and South Africa, 2020
(MMWR, September 18)
- To assess influenza activity, researchers at the U.S. Centers for Disease Control and Prevention looked at both the number of specimens submitted for flu testing as well as the proportion of tests submitted that were positive for influenza at 300 commercial labs in all 50 states and Puerto Rico that routinely collect data as part of influenza surveillance. They also participated in analysis of data from the World Health Organization on influenza activity in the Southern Hemisphere, which is currently in its main flu season and often serves as a sentinel for the coming flu season in the Northern Hemisphere.
- In the U.S., flu activity usually starts to rise around October, typically peaks in December or January and trails off in March or April although it can extend through May. At the end of the 2019-20 flu season, there was a decrease in both the number of specimens being submitted for flu testing as well as the proportion testing positive for influenza, amounting to a 98% reduction in influenza activity. From May through August, influenza activity in the U.S. has remained at historically low levels with only 0.2% of test results positive compared to 2.4 % in 2019, 1% in 2018, and 2.4% in 2017. In the Southern Hemisphere, specimens testing positive in South Africa, Chile and Australia showed a test positivity of 0.06% from April to July 2020 compared to 13.7% test positivity for the same time period in 2017 to 2019.
- Although PHSMs as a whole are thought to contribute significantly to this decrease, it is difficult to state exactly what the role or association of each PHSM (e.g. school closure vs. masks vs. physical distancing) may be in decreased influenza activity. The authors acknowledge that they have established a temporal ecological association rather than a causal one. The role of viral interference—one virus competing with another to infect the host—is not measurable. Other factors such as decreased travel and increased vaccine use may have also contributed to a decrease in influenza activity and were not evaluated in this study.
Suggested citation: Cash-Goldwasser S, Jones SA, Bochner A, Cobb L and Frieden TR. In-Depth COVID-19 Science Review September 12 -18, 2020. Resolve to Save Lives. 2020 September 22. Available from https://preventepidemics.org/covid19/science/review/