Estimating the true number of COVID-19 cases and the case detection ratio in the United States
The importance of understanding the case detection ratio
There is disagreement about how many total COVID-19 cases truly exist in the U.S. There may be vast discrepancies between the number of confirmed cases and the true number of infections. A diagnosis of COVID-19 is confirmedwhen SARS-CoV-2 is detected in a clinical sample using molecular testing (such as PCR). Early in the pandemic, when testing was restricted to symptomatic people due to limited test availability, many infections were not diagnosed. It has been estimated that the true number of infections in the U.S. in April may have been 10-20 times higher than the number of confirmed cases. However, even if COVID-19 testing capacity is unlimited, under-diagnosis is still a concern, in large part because infections can be asymptomatic and contact tracing may not identify people who are infected.
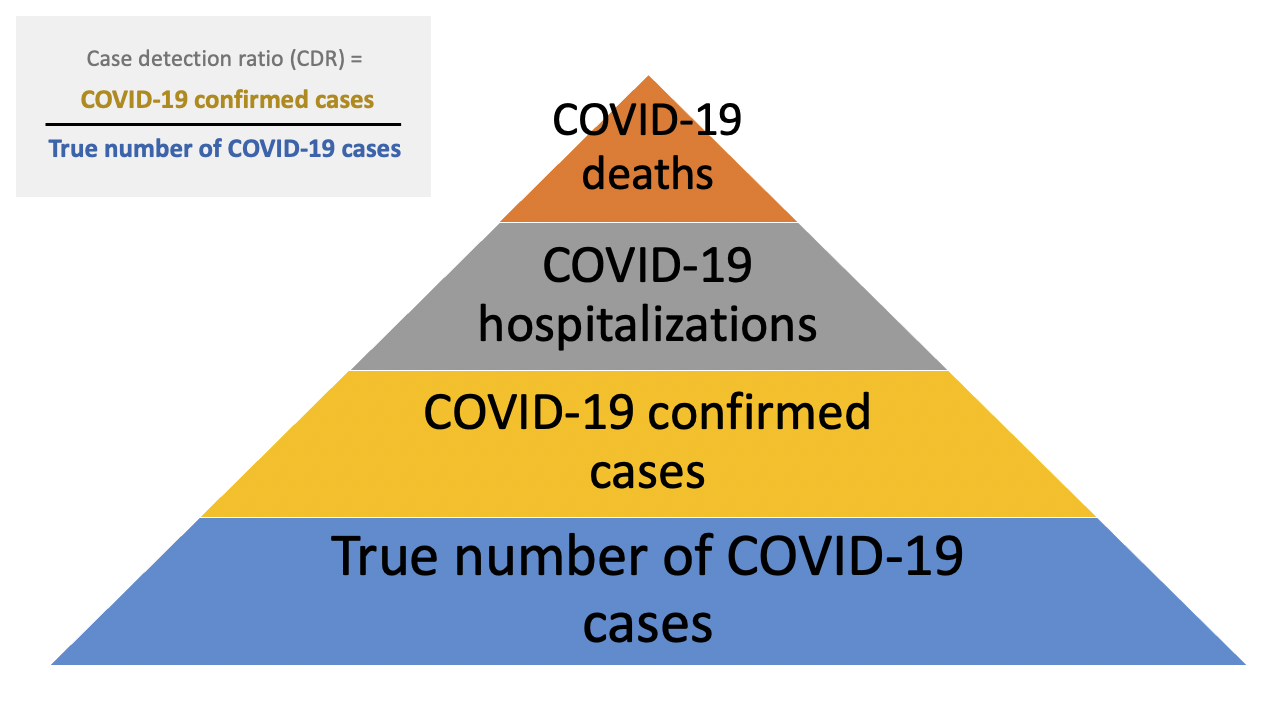
One approach to quantifying both the extent of under-detection and the true number of COVID-19 cases is to estimate what proportion of infections are being detected. This can be conceptualized as the case detection ratio (CDR).
Factors that contribute to low case detection ratios
Several factors may influence the COVID-19 CDR. A major factor is testing availability. In the early months of the COVID-19 epidemic in the U.S., diagnostic testing capacity was severely limited. Early data on the number of deaths per case suggested that many SARS-CoV-2 infections were not detected, with barriers to testing reported across the United States. Over time, test capacity has improved and testing rates have increased.
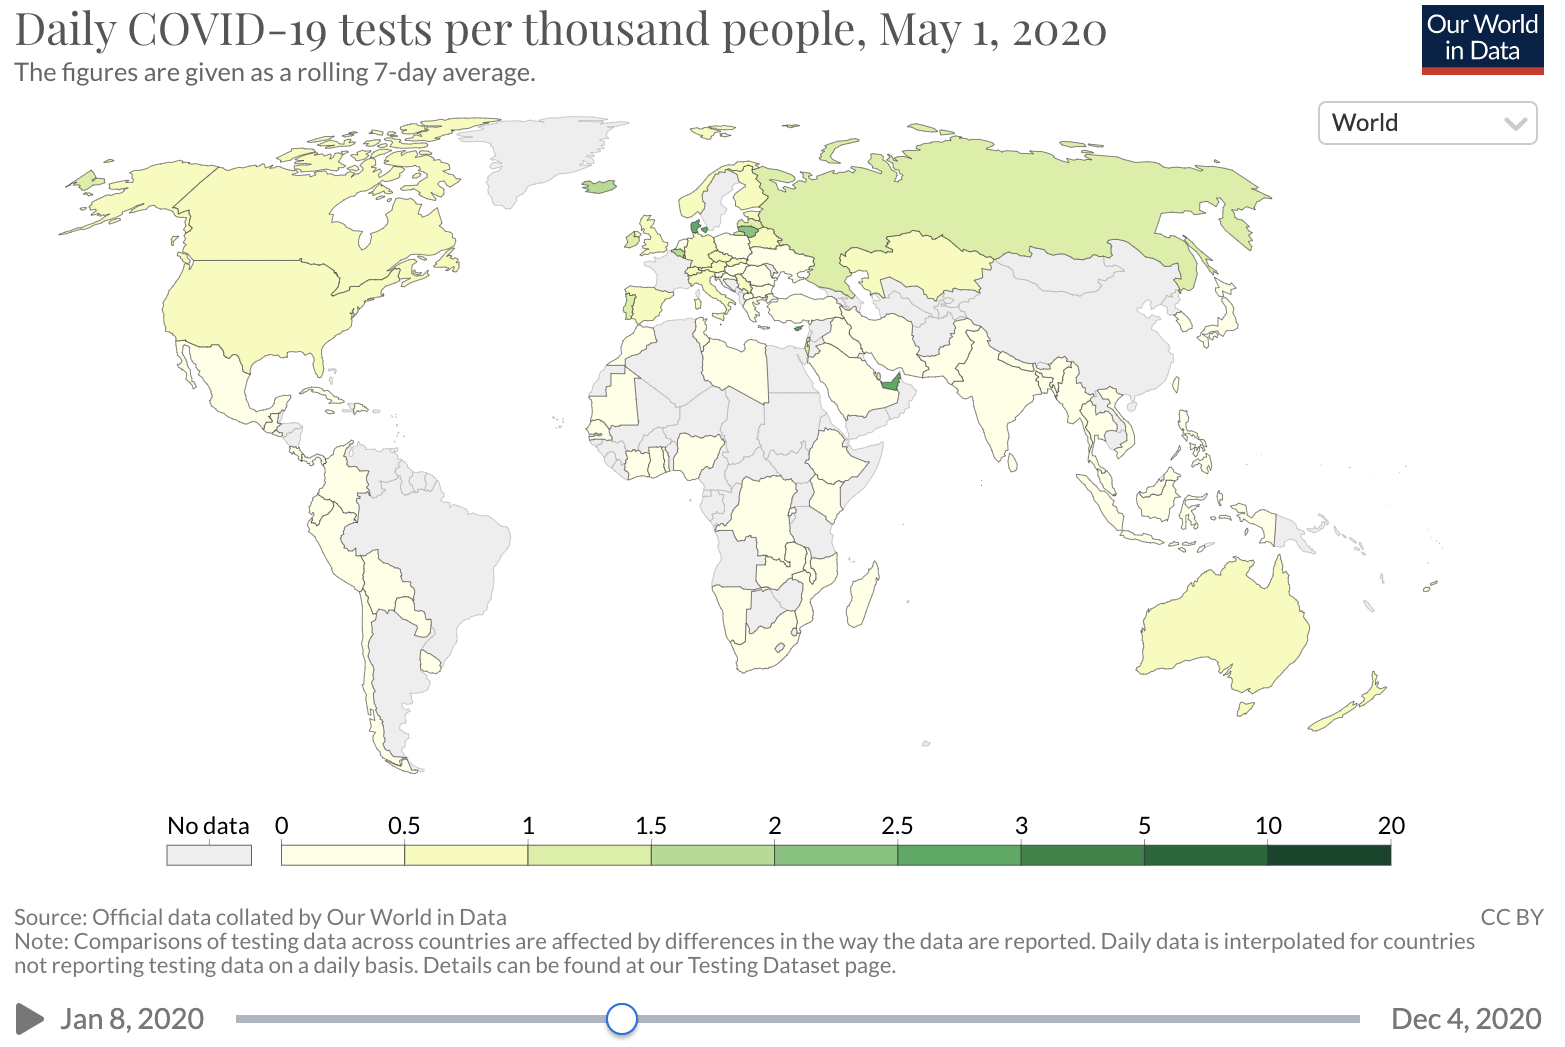
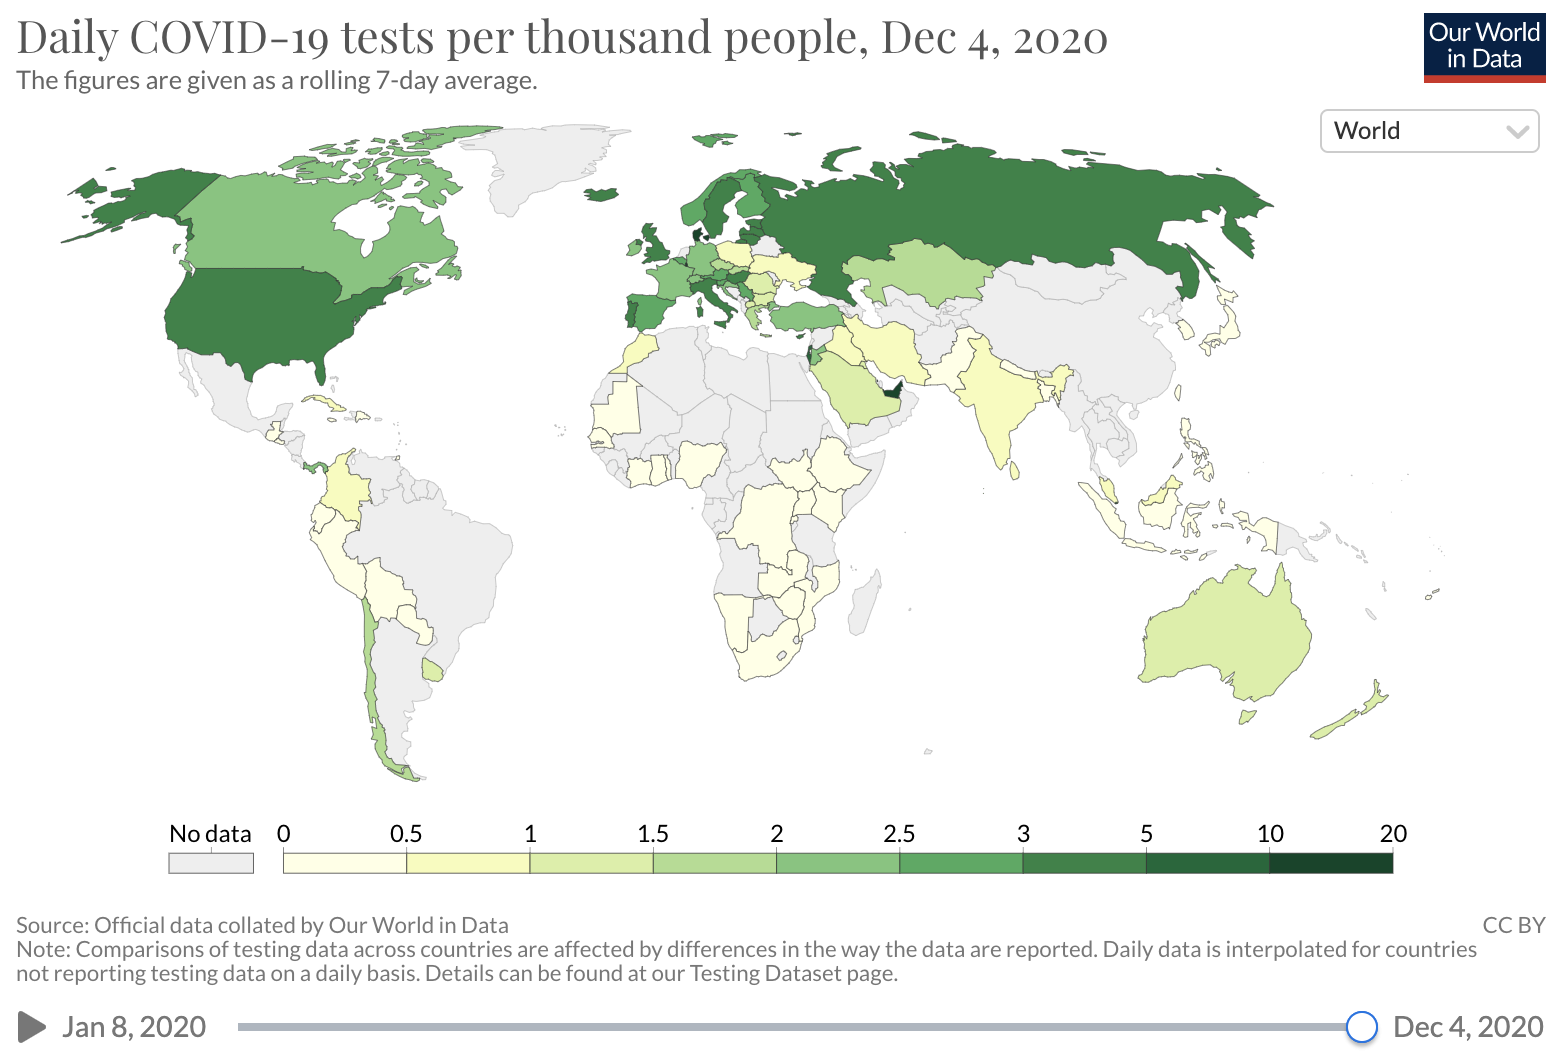
Source: Our world in Data
Unfortunately, COVID-19 case counts have recently increased dramatically in the U.S., and continue to rise. Barriers to accessing tests are again being reported. The test positivity rate (the proportion of tests administered that have positive results), which was high at the beginning of the pandemic and then fell as testing became increasingly available and transmission declined, has recently risen. This suggests that test capacity may not be keeping up with demand, and that a lower proportion of total COVID-19 infections is being detected.
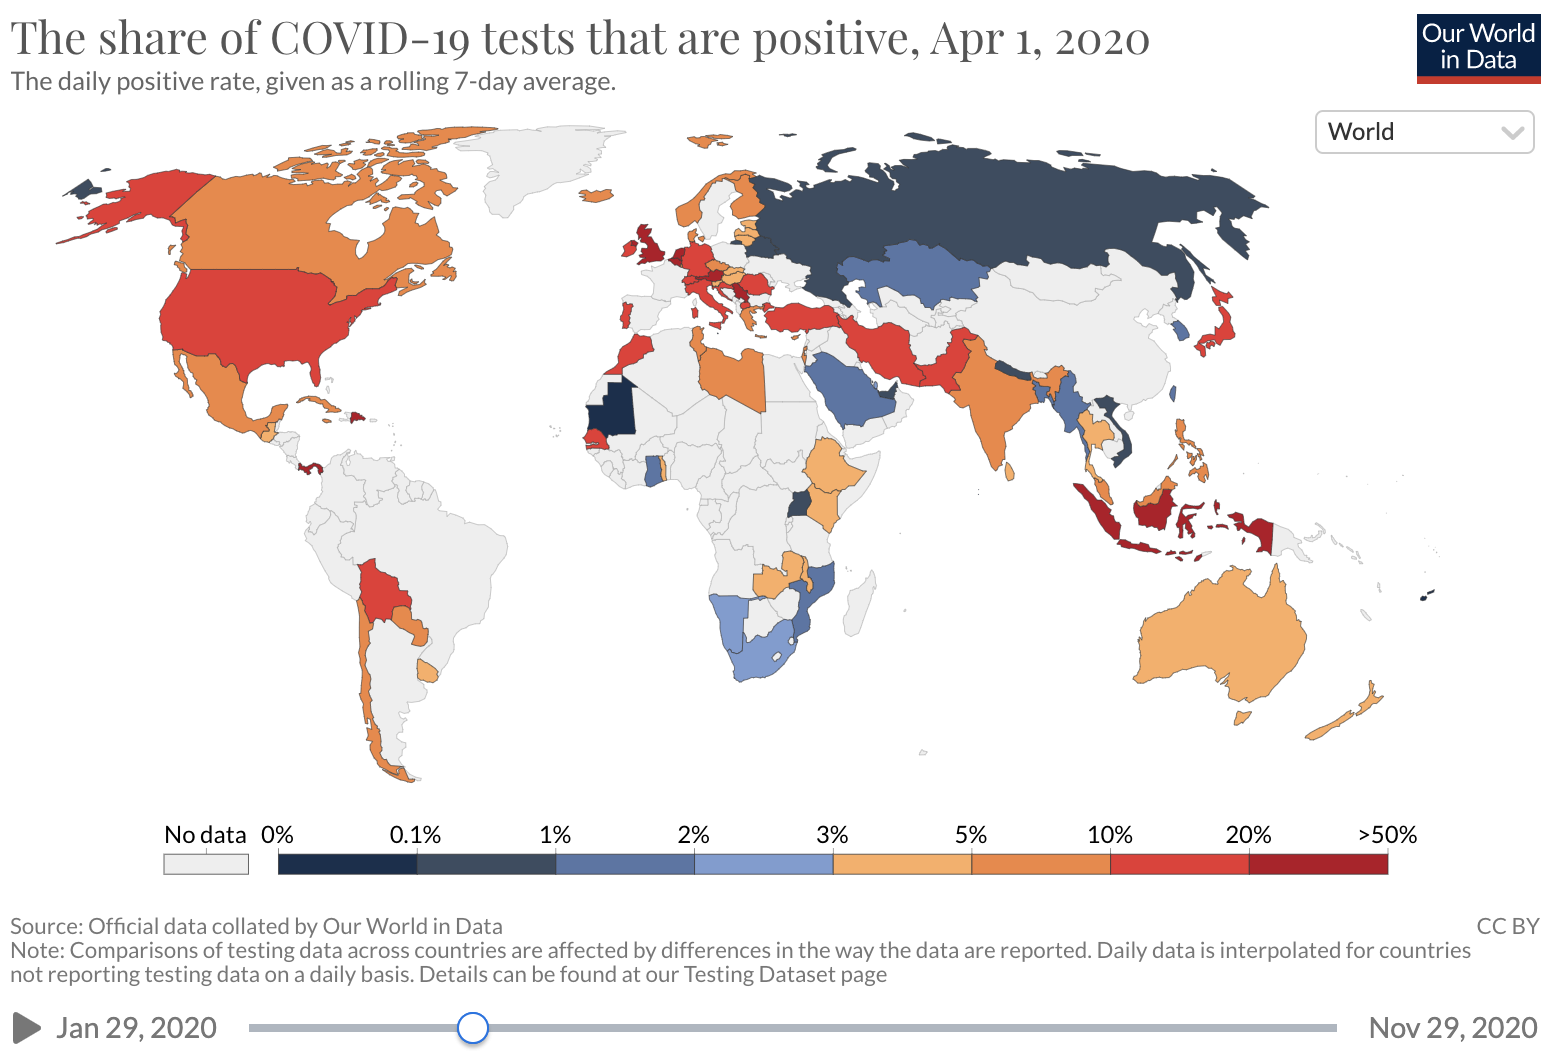
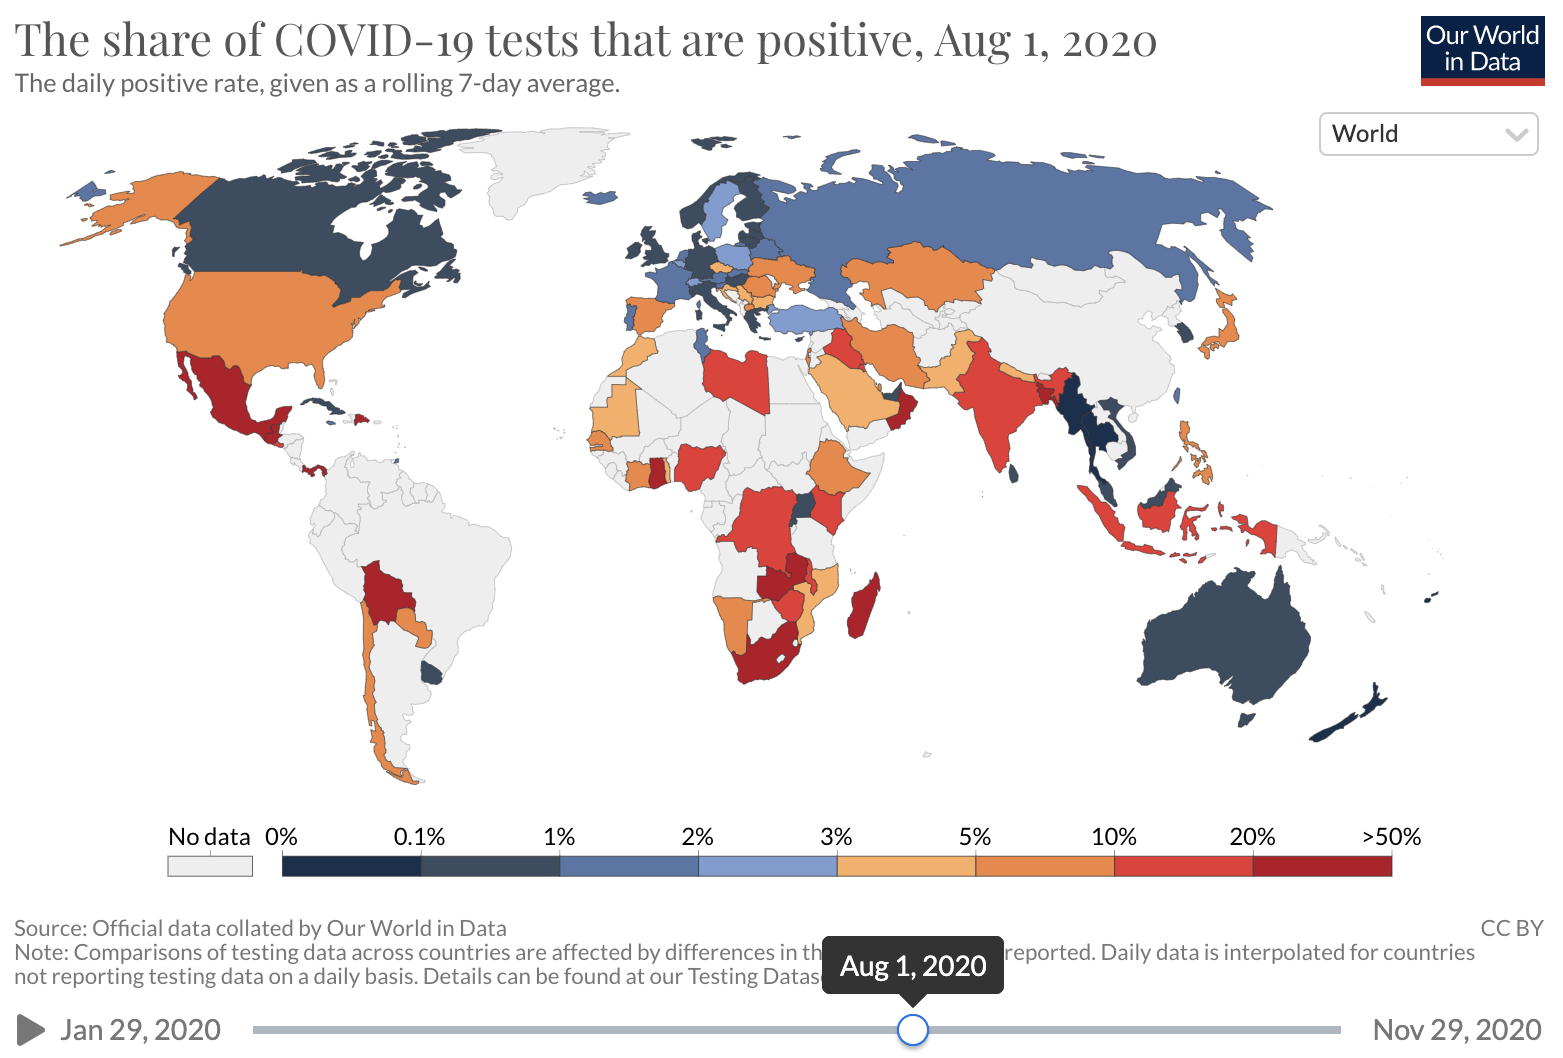
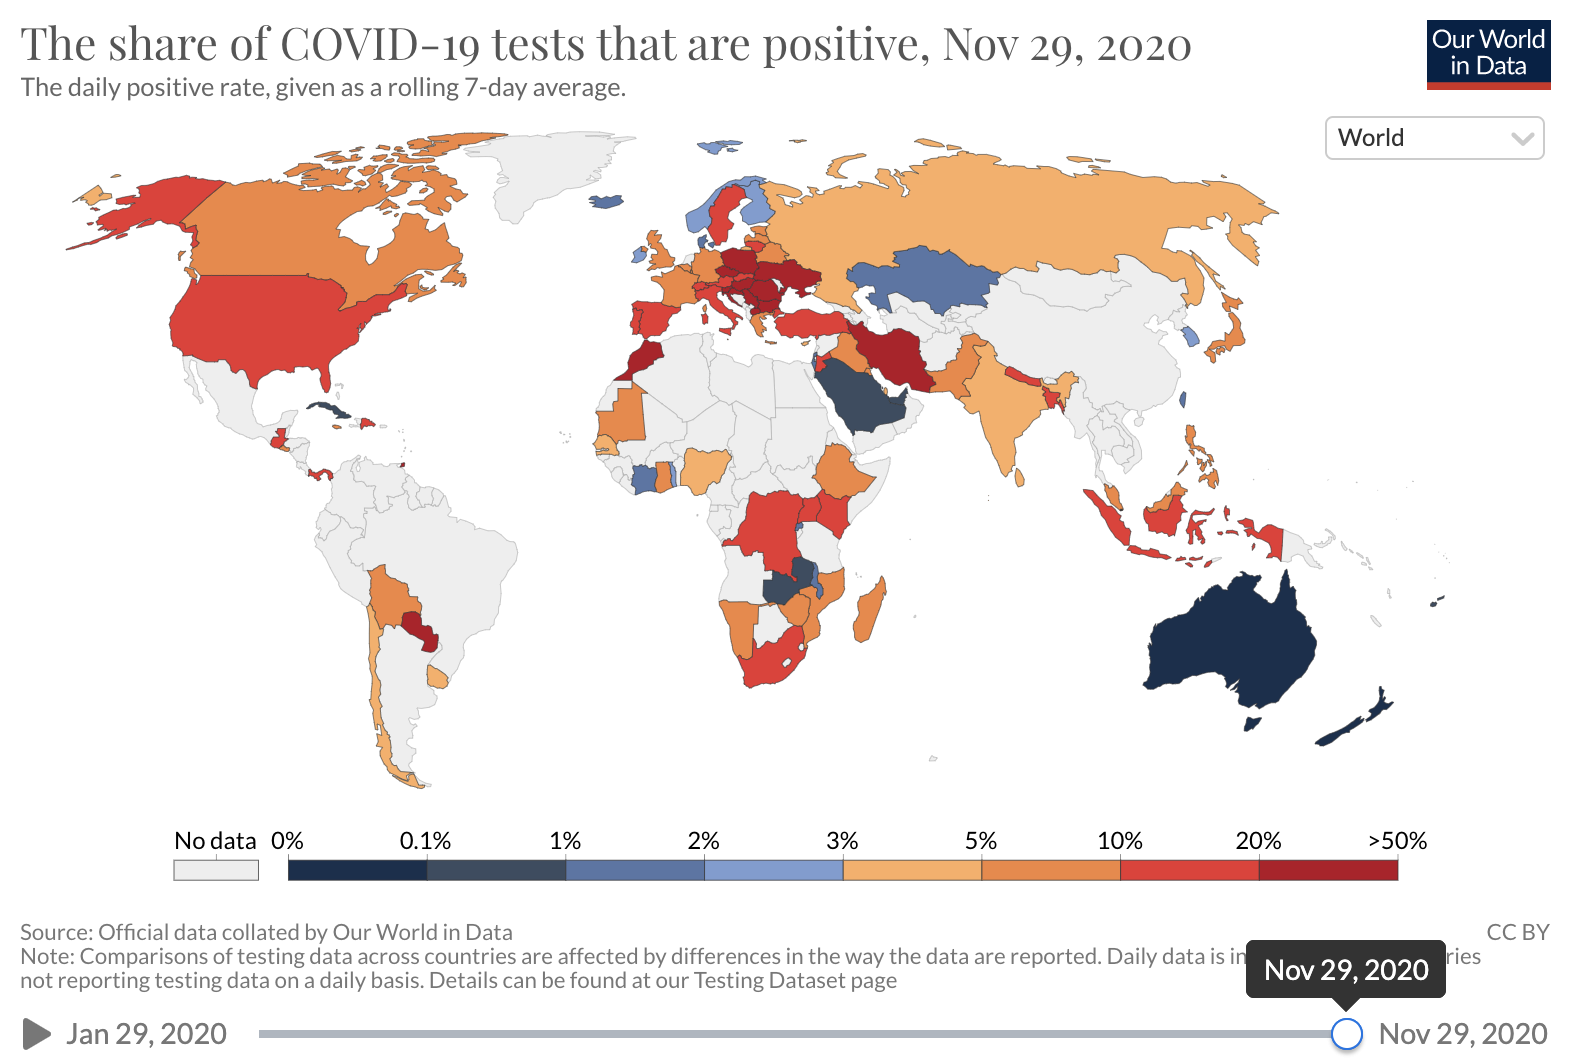
Source: Our world in Data
As we previously wrote, when reporting on sparse testing in resource-limited settings, and when testing capacity is constrained, it is appropriate to prioritize certain patient or population groups. However, testing limitations preclude a complete understanding of the spread of COVID-19, especially among those who have milder illness and among those who live in certain geographic areas, are lower-income, or are from certain racial or ethnic groups.
Another major factor that lowers the CDR is that a significant proportion of those with COVID-19 are asymptomatic(see below for a review of this article) and therefore may not seek testing. The CDR can be increased by testing all close contacts of confirmed COVID-19 cases, regardless of symptoms. However, this strategy may be difficult to implement because of resource constraints and other factors that may stymie efforts to successfully conduct contact tracing.
Other factors that may contribute to low CDRs are reduced rates of people seeking health care, failure of health care workers to test patients, and false negative test results.
How to estimate total cases and the case detection ratio
One approach to estimating the true number of cases and the CDR is to extrapolate from seroprevalence data. For a study on the proportion of people who previously had COVID-19, serum samples submitted across the U.S. during four time periods between July and September for reasons unrelated to COVID-19 were tested for antibodies to SARS-CoV-2. Jurisdiction-level seroprevalence over the study period ranged from less than 1% to 23%. Seroprevalence was used to calculate jurisdiction-specific ratios of estimated total infections to confirmed cases. This estimate varied significantly among locations and over time, with most infections detected in some situations and fewer than one in ten infections detected in others. A CDC database of seroprevalence data, obtained in a number of U.S. locations during several time periods, shows a similarly wide range of seroprevalence and CDR estimates. Major limitations of using seroprevalence data to calculate total infections is that estimates apply to the time periods when data were collected—extrapolating to other time periods may be invalid if test capacity and other epidemic parameters have changed. An additional limitation of seroprevalence data is that limited sensitivity and specificity of antibody tests may result in inaccurate estimates.
An alternative approach to calculating the true number of SARS-CoV-2 infections is to estimate or model total infections based on the number of confirmed cases, taking account of the proportion of infections that are asymptomatic, and adjusting for factors that influence the CDR. A recent study estimated the true incidence of COVID-19 in the U.S. from February to September by modeling the effects on the CDR of health care seeking patterns, test completion rates, and test result accuracy. Authors estimated that the 6,891,764 cases of symptomatic COVID-19 confirmed in the U.S. actually represented 52,885,526 total infections, implying that only 13% of infections (1 in every 8) were identified.
A third way to estimate the true number of COVID-19 cases and the case detection ratio is to back-calculate total cases from COVID-19 death data, accounting for the lag between cases and deaths. Death data are easier to ascertain than the number of cases, and are a relatively reliable starting point. Using this approach, an estimate is needed of the proportion of all COVID-19 cases (diagnosed and undiagnosed) who died from the disease. This statistic, called the infection fatality rate (IFR), is challenging to estimate and varies across populations due to factors such as age and health care access. The IFR can be estimated by testing a representative sample of the population (including asymptomatic people) for COVID-19 and following them over time to determine the death rate. This can be accomplished via closed natural experiment (as occurred on the Diamond Princess cruise ship) or if there is widespread COVID-19 testing and population monitoring over time (as was done in Iceland). There may be significant differences in IFR between locations and over time because of differences in population age structure and who is getting infected (older people with COVID-19 are far more likely to die than younger people), changes in medical care (fatality rates may fall if treatments become available or rise if hospitals are overcrowded) and other factors. The range of CDRs that may be derived from IFR estimates likely reflects both true differences in CDRs as well as differences in how IFRs were estimated.
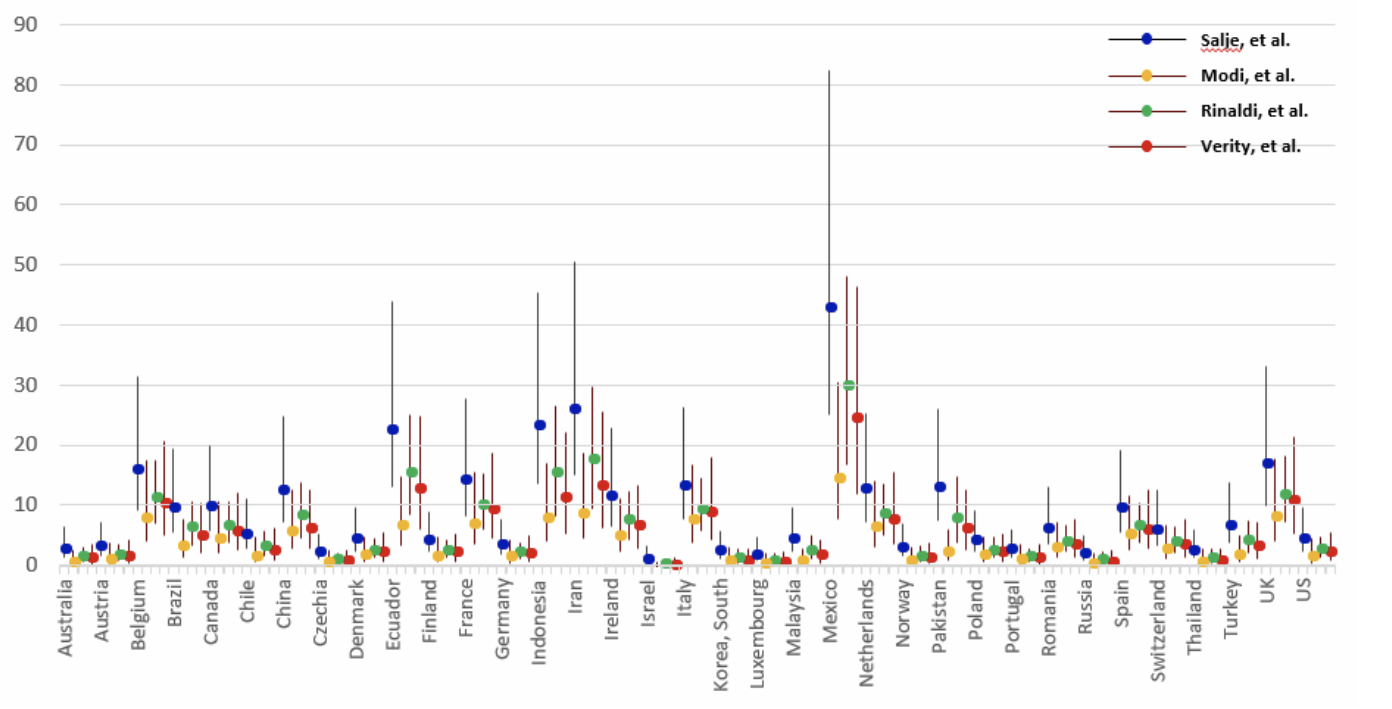
Source: Oliver Wyman
One “nowcast” model incorporates IFR to predict current total COVID-19 cases and the CDR in the United States. This model estimates that ~14% of the U.S. population has had COVID-19, for a total of ~46,000,000 cases, and that there are currently 2.3 undetected infections per each detected case (CDR = 0.30, or approximately one in three infections are detected). Modeled per-state estimates vary, from 5.1 undetected infections per detected case in New York, to 3.1 undetected infections per detected case in Pennsylvania, to less than one undetected infection per detected case in many other states. Similar to seroprevalence data, IFR estimates made using historical data may not reflect the current situation, and death data is a “lagging indicator” because it largely reflects new cases that occurred at least 3-4 weeks prior.
Another method of “nowcasting” total infections is using confirmed COVID-19 case and test positivity data. Conceptually, if two states report the same case incidence but one state reports higher test positivity, the true incidence is likely higher in the state with higher test positivity. A model that uses this approach estimated that on Nov. 19, ~16% of the U.S. population had had COVID-19 (corresponding to ~52,000,000 total cases), including 8.3 million current infections (corresponding to one in 40 people being currently infected). This model also shows that the proportion of the population actively infected varies greatly between states. Examples of Nov. 19 estimates are 6.5% in South Dakota, 5.3% in Minnesota, 2.5% in Arizona, 1.2% in New York and 0.5% in Maine.
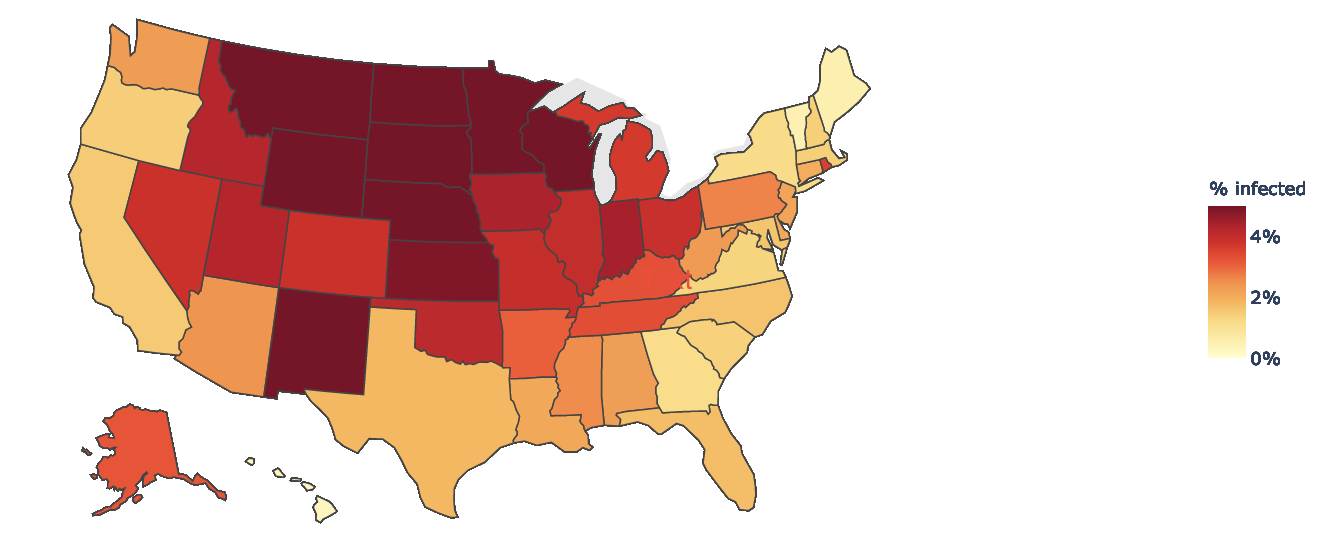
Source: COVID-19 Infection Maps
The higher the proportion of total COVID-19 cases detected, the more we understand disease transmission risk and can implement effective disease control strategies. Ideally, most people with COVID-19 would be diagnosed, but this is especially challenging if testing capacity is limited and because many infections are asymptomatic, and as case numbers increase. Although there is no perfect way to estimate the true number of SARS-CoV-2 infections, modeled estimates suggest there have been 50 million or more people infected in the U.S., which is many times higher than the reported 14 million cases. We know there are many more active infections than currently reported; estimates concur that for every COVID-19 case detected today, there are likely at least two infections that go undetected. The proportion of infections that are undetected varies widely by location and changes over time. Attempts to estimate total cases and track the CDR, using the most robust methods available, make it possible to address case under-detection, inform the public about the true spread and risk of disease, and use targeted mitigation efforts to control the pandemic. Consistently estimating the CDR in an area, and working to increase the proportion of total cases detected, is an important strategy to help control COVID-19.
Excess mortality during the COVID-19 pandemic
Excess mortality is the difference between expected and observed deaths. Tracking excess mortality is a critical aspect of COVID-19 surveillance because it can provide a more complete picture of the true impact of the pandemic: from the disease itself; from strains on the health care system; and from broader consequences of social determinants of health, such as poverty. Estimating excess mortality relies on using historical mortality data to project the expected number of deaths from all causes during a given time period and comparing the expected deaths with the observed number of deaths. Excess deaths are generally broken down into two categories: those thought to be due to a specific cause (direct excess deaths or in this case deaths caused by COVID-19), and those thought to be associated with but not due to the specific cause (indirect excess deaths). Excess mortality can be calculated in several ways, with some researchers counting any death over the expected average mortality as an excess death, and others using a more conservative approach and counting only those deaths over the upper bound threshold of the estimate for expected deaths.
Analyzing excess mortality estimates can shed light on broader impacts from the pandemic. Demographic analysis, for example, can provide insight on which age groups, races or ethnicities may be disproportionately affected both directly as well as indirectly by COVID-19. Cause-of-death analysis for indirect excess deaths can help show where the strains on the health care system are manifesting most strongly. In addition to capturing known and confirmed deaths due to COVID-19 (see our report on COVID-19 death definitions in a previous Weekly Science Review), excess deaths also capture COVID-19 deaths that were misclassified due to lack of testing, the death occurring at home, incomplete and inaccurate death certificates, or other reasons. Excess deaths also account for deaths that occurred as a result of the overall impact of the pandemic on health care and society, such as deaths resulting from waiting too long to seek care for a problem not related to COVID-19, diversion of health services during the pandemic, or loss of support systems.

Source: Washington Post
According to data from the U.S. Centers for Disease Control and Prevention (CDC), which collects mortality data from all jurisdictions in the U.S., the first excess deaths were observed in the country during the week ending on March 28, 2020. Since then there has been excess mortality over what would be expected for every subsequent week, based on standardized provisional death data. Excess deaths peaked during the week ending on April 11 and had a smaller peak in August. In an analysis published in Morbidity and Mortality Weekly Report, researchers at the CDC evaluated excess deaths from January to October and found that during this period, there were almost 300,000 more deaths than expected over the projected average (225,000 more than the upper bound threshold). They estimated that at least two thirds of these were direct excess deaths from COVID-19, and more than 100,000 deaths were either COVID-19 deaths not classified as such, or deaths from other causes because of disruption caused by the pandemic. Although the number of excess deaths in this analysis was highest among people 75 to 84 years old, the percent increase in mortality was highest for those 25 to 44 years old, with a 26% increase in observed deaths over the average expected mortality. The mortality for those under 25 years old was lower in this analysis than what would be expected. This can be in part due to protective effects of stay-at-home orders (e.g. fewer traffic collisions and injury deaths) combined with the fact that deaths from COVID-19 are much less common in this age group.
When the same researchers evaluated excess mortality by race and ethnicity, they found discrepancies similar to what is being observed in overall COVID-19 mortality. Although people of all races and ethnicities are experiencing mortality in excess of what would be expected, the number of all-cause deaths during the period examined was 12% higher than expected among whites, 54% higher among Latinx and 33% higher among Blacks. These findings document the striking and unacceptably high burden of both the pandemic and its disruption on Latinx and Black communities.
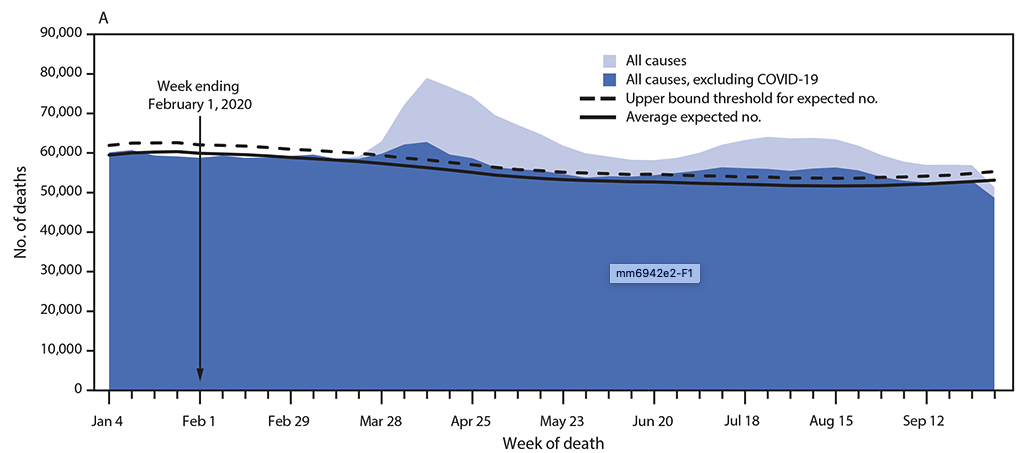
Source: CDC MMWR
Excess deaths have affected different parts of the country differently over time, as has the COVID-19 pandemic. Three states with the highest COVID-19 mortality from March to August—New York, New Jersey and Massachusetts—accounted for almost a third of all excess COVID-19 deaths nationally during this time period. Researchers from the New York City Department of Health and Mental Hygiene published a report on their analysis of excess deaths from March 11 to May 2 in one of the hardest hit parts of the country. In their report, they found that of 32,000 deaths reported electronically to the department, approximately 24,000 were in excess of the expected baseline. Confirmed and probable COVID-19 deaths accounted for 78% of these excess deaths, leaving more than 5,000 deaths that may have been unreported COVID-19 deaths or deaths indirectly attributable to the pandemic. Another study examining New York City and other excess deaths estimated that from March 1 to April 25, the five states with the highest death toll from COVID-19 also experienced increases in deaths due to nonrespiratory conditions. Overall, deaths from diabetes and heart disease nearly doubled in these states, and deaths from Alzheimer disease and strokes also saw significant increases (65% and 35%, respectively). In New York City, there was a 398% increase in deaths from heart disease, and a 356% increase in deaths from diabetes. Similar to the CDC study, two thirds of excess deaths could be directly attributed to COVID-19.
The authors from the New York City health department note that monitoring all-cause mortality with nearly real-time electronic death reporting can provide a “faster and more inclusive measure of the pandemic’s impact on mortality” than relying solely on other COVID-19 death reporting mechanisms. It cannot be conclusively determined if nonrespiratory deaths from conditions known to be associated with or complications of COVID-19 (e.g. heart disease, diabetes, stroke) were misclassified or due to reduced and delayed access to health systems. One study that expanded its excess mortality analysis from an initial publication in July found that deaths from Alzheimer disease and dementia increased twice, coinciding with the first peak and summer surge of COVID-19.
The changing shape of the pandemic requires innovative approaches to track its burden. Another way to do this is by looking at years of life lost (YLL), an indicator that allows for consideration of premature mortality by factoring in both the age at which deaths occur as well as the number of deaths. Although in April, 80% of excess YLL were among people over 65 years old, by June, this proportion had dropped to 36%. An analysis of several private health insurance companies in the U.S. estimated that working adults between 20 and 64 years old accounted for 47% of excess YLL. Although less attention has been given to how the pandemic has affected younger adults, who have a significantly lower infection mortality rate, the burden of the pandemic is still quite pronounced. A preprint study looking at excess deaths, YLL and excess YLL among those 25 to 44 years old found that YLL among these younger adults surpassed that from overdose-related deaths, and that in some parts of the country experiencing major outbreaks, COVID-19 is likely already a leading cause of death in this age group. Another study evaluating the effect of primary school closures during the COVID-19 pandemic suggested that these closures could be associated with decreased life expectancy for U.S. children, and may result in over five million years of life lost. These types of analyses can help policymakers balance difficult trade-offs during the response to the pandemic.
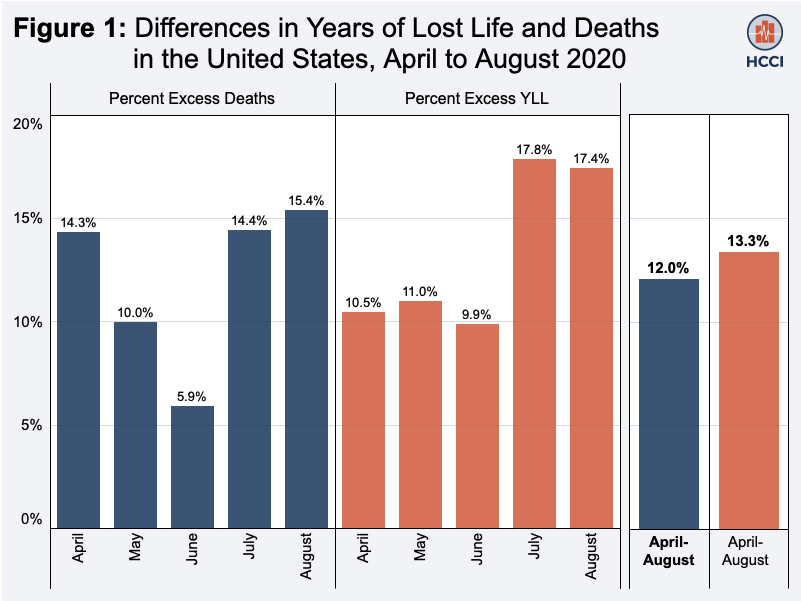
Source: Health Care Cost Institute
Weekly Research Highlights
Racial Disparities in COVID-19 Mortality are Driven by Unequal Infection Risks
(Clinical Infectious Diseases, Nov. 2020)
- This study used microdata of all confirmed and probable cases and deaths recorded in Michigan in the spring and early summer; in total, the researchers looked at data from 49,701 confirmed cases that had complete information for age, sex and race (out of a total of 73,441 cases recorded).
- Compared to whites, adjusted COVID-19 incidence was 5.5 higher in Blacks, 3.1 times higher among Latinos, 3.9 times higher among people of other races, and 1.7 times higher among Asian Pacific Islanders; there was no difference between whites and Native Americans. Mortality rates among those who contracted COVID-19 were similarly elevated: compared to whites, mortality was 6.7 times higher among Blacks, 1.9 among Latinos, 3.4 among people of other races, and 1.4 among Asian/Pacific Islanders.
- Age-specific mortality rates were significantly higher among Blacks compared to whites (for all age groups from 30-70), but were similar between other race/ethic groups and whites.
- In a counterfactual analysis where the incidence rates among whites were substituted for those of non-whites in the non-white population, an 82% reduction in deaths was observed among Blacks, 57% among Latinos and 35% among Asian/Pacific Islanders. By contrast, when the case fatality rates from the white population were substituted instead, a decrease in mortality was only observed among Blacks (19%).
- Limitations of this paper include the fact that almost one third of cases in Michigan had incomplete data and could not be included. Systematic differences in whose data is complete could bias the analysis. Further, the study includes only infections that were recorded. Access to testing might have varied systematically across race/ethnic groups, potentially leading to undercounts of infections among some groups compared to others.
The Advisory Committee on Immunization Practices’ Interim Recommendation for Allocating Initial Supplies of COVID-19 Vaccine — United States, 2020
(MMWR, early release Dec. 3)
- Health care workers are critical to the ongoing pandemic response, and inherently work in an environment that has a higher risk for exposure and transmission. As of Dec. 1, an estimated 245,000 health workers had developed COVID-19, and at least 858 had died from it.
- Residents of long-term care facilities typically have high rates of underlying medical conditions that put them at greater risk for severe illness, and since they live in congregate settings they have a higher risk of exposure and transmission. As of Nov. 15, in skilled nursing facilities alone (a subset of long-term care facilities), about 500,000 residents had developed COVID-19, including at least⏤70,000 deaths (more recent estimates are closer to 100,000⏤about 40% of overall deaths.
- ACIP estimates that there are 21 million health care personnel providing clinical as well as allied service workers who would be offered vaccination during this phase, including paid and unpaid workers in a variety of health care delivery settings such as hospitals, outpatient centers and dialysis clinics. The committee estimates that about 3 million adults live in long-term care facilities and should be included in this initial phase of vaccination.
- State and local health departments will be responsible for implementing vaccination plans using these recommendations, including identifying subsets of health care workers who would be offered vaccination first.
Estimating the Extent of Asymptomatic COVID-19 and its Potential for Community Transmission: Systematic Review and Meta-analysis
(JAMMI [Official Journal of the Association of Medical Microbiology and Infectious Disease Canada], Oct. 2020)
- In contrast to previous studies, this meta-analysis only included studies where there was sufficient follow-up to distinguish between people who were presymptomatic at testing and those who were asymptomatic.
- Included studies were either conducted in skilled nursing facilities which had a mean age of 75 or higher (five studies) or followed contacts of cases in the general community (mean age 31 or higher). Although there were children and young adults in the community samples (6% to 24%), no studies focused specifically on this population, which is thought to have a higher rate of asymptomatic infection.
- The percentage of asymptomatic infection in the included studies ranged from 4% in a study in Korea to 40% in a study in Italy and a U.S. nursing facility. Overall, in the skilled nursing facilities, the percent of asymptomatic cases was 20% (95% CI: 14 – 27%); in the community studies it was 16% (13 – 19%).
- Limitations of the meta-analysis included the fact that many of the studies had incomplete follow-up and/or testing of the population. Further, most did not clearly define “asymptomatic,” making it possible that people with mild symptoms were classified as asymptomatic or that studies were not comparable.
Suggested citation: Cash-Goldwasser S, Kardooni S, Cobb L, Bochner A, Bradford E and Shahpar C. In-Depth COVID-19 Science Review November 14 – December 4, 2020. Resolve to Save Lives. 2020 December 8. Available from https://preventepidemics.org/covid19/science/review/