Preparedness for global health threats
Since the SARS epidemic of 2003, there has been a renewed emphasis on improved global preparedness for health threats. The International Health Regulations were revised in 2005 (IHR 2005) to broaden the scope of prior regulations to include new and re-emerging diseases and to implement rapid reporting procedures for potential public health emergencies of international concern. Under IHR (2005) States Parties (the WHO term for countries, basically) are also required to develop, strengthen and maintain core public health systems to find, stop, and prevent diseases. Despite all 194 WHO Member states agreeing to the binding measures outlined in IHR (2005), progress on developing preparedness systems from 2007 to 2014 was slow. In 2014, the Global Health Security Agenda (GHSA) was launched to accelerate IHR adherence and provide financial and technical support to countries committed to preparedness. In 2016, a new voluntary assessment tool, the Joint External Evaluation (JEE) was launched to provide a transparent, external evaluation of a country’s ability to find, stop, and prevent disease threats. Similar to a report card, there are 19 areas of epidemic preparedness and response capacity that are scored in the JEE, first by a group of domestic experts, and then by an external group of international experts. The assessment is voluntary and the results are reported by the World Health Organization. Resolve to Save Lives created a summary metric called the ReadyScore, to capture the JEE scores in one number that reflects a country’s level of preparedness.
The foundation of good preparedness is a strong health system with trained and motivated health workers, a well-maintained infrastructure, and a reliable supply of medicines and technologies, backed by adequate funding, strong health plans and evidence-based policies. To prepare for health threats such as COVID-19, countries should develop core areas including surveillance, laboratory, a trained workforce and emergency operations. National, intermediate and community-level response plans for relevant biological, chemical, radiological and nuclear hazards. Other components of preparedness include mapping of potential health threats, identification of available resources, development of appropriate national stockpiles of resources, and the capacity to support response operations at the intermediate and community levels during a public health emergency.
The state of global preparedness before COVID-19
Even prior to COVID-19, there was consensus that the world was not prepared for global health threats. In 2019, the Global Preparedness Monitoring Board, an independent monitoring and advocacy body, concluded that the world needs to proactively establish the systems needed to detect and control potential disease outbreaks. Information from the Prevent Epidemics ReadyScore showed that most countries were not prepared to find, stop, and prevent disease threats. As the COVID-19 pandemic has spread, these preparedness gaps in countries have been exposed. The Global Health Security Index launched in 2019 found that no country is fully prepared for epidemics or pandemics, and every country has important gaps to address.
Does it matter in COVID-19?
The obvious question is whether the preparedness level of a country has made a difference in the current COVID-19 pandemic. Do countries that score higher on preparedness for more common outbreaks and epidemics perform better in the current pandemic? The relationship between preparedness and COVID-19 impact is difficult to answer, as both are complex and hard to measure. In this insight, we used simple metrics for each to see if any patterns emerged.
Assessing country preparedness
Several country-level preparedness indicators exist including:
- IHR State Parties Self-Assessment Annual Reporting tool (SPAR). The only mandatory (under IHR 2005) obligation for reporting on progress toward building preparedness and response systems. SPAR is self-reported annually and subject to bias, although it has improved in recent years.
- Prevent Epidemics ReadyScore. The ReadyScore is a simple number that estimates country preparedness for the nearly 100 countries that completed and reported status on a Joint External Evaluation.
- Global Health Security Index. An index of the global health security capabilities in 195 countries prepared by the Johns Hopkins Center for Health Security, the Nuclear Threat Initiative (NTI) and the Economist Intelligence Unit (EIU).
For the purposes of this analysis we used the ReadyScore to capture country preparedness
Assessing an effective response to COVID-19
The COVID-19 pandemic has impacted different countries at different times, with some countries having more time to prepare than others, which makes comparisons challenging. In addition, differences in testing and the amount of data shared limit comparisons. To assess the overall impact of COVID-19 on a population, several measures can be considered.
- Case counts. Case counts and trends are highly dependent on the testing strategy used in a population. They also depend on the types of cases (asymptomatic, presymptomatic, symptomatic, deaths, recovered) detected. Testing data is currently variable in availability and quality.
- Death counts. Deaths are easier to detect than cases, but are highly dependent on age distribution, burden of underlying conditions, and case management. In some locations with a large proportion of community deaths, COVID-19 deaths may be undercounted.
- Case fatality ratio (CFR), or the number of deaths from COVID-19 out of the total number of COVID-19 cases captures several aspects of the COVID-19 response. In a better prepared healthcare system, the number of deaths should be reduced as cases are detected earlier, and hospitals are better prepared to manage severe cases. The number of cases should also be higher, as more testing is done to understand the full extent of COVID-19 spread in a community and to support isolation and quarantine measures. Overall, the lower the CFR the better, although its magnitude depends on the age distribution of the population and other factors.
- Age-adjusted CFR. Similar to the CFR but accounts for the age of the population. Limited by the availability of age-specific death data.
- Lag-adjusted CFR (LA-CFR). Similar to the CFR but accounts for a two-week lag between illness onset among cases and deaths. This adjustment is made by using current cumulative deaths in the numerator, but cumulative case counts from 14 days ago in the denominator. It also avoids an underestimation of true CFR during exponential growth, as recent cases may be rising without corresponding deaths (because of the lag).
- Case-PHSM interval. It is clear that earlier implementation of COVID-19 interventions results in slower and less overall transmission. The timing of public health and social measure (PHSM) implementation can be compared to epidemiologic thresholds (e.g. first case detected) to provide a country-specific indicator of response timeliness.
For the purposes of this analysis we examined total death rate, lag-adjusted fatality rate, and case-PHSM interval. For the last measure, we calculated the interval between the date of the first COVID-19 case in a country with the date of the first PHSM implemented. Unfortunately, information on age-specific mortality was not available to enable calculation of age-adjusted case-fatality rates.
Preparedness and key indicators
We selected 29 countries that had data available (testing and ReadyScore) and represented a demographic and geographic mix of countries around the world (Table). Some high-burden countries such as China, Italy, France, Germany, Russia and Brazil were not included because they did not complete a JEE and did not have a ReadyScore.
| Country | ReadyScore |
| Canada | 93 |
| Singapore | 93 |
| Australia | 92 |
| Japan | 92 |
| Republic of Korea | 92 |
| UAE | 91 |
| New Zealand | 89 |
| Switzerland | 89 |
| USA | 87 |
| Finland | 86 |
| Oman | 84 |
| Slovenia | 82 |
| Saudi Arabia | 76 |
| Thailand | 76 |
| Latvia | 73 |
| Indonesia | 64 |
| South Africa | 62 |
| Rwanda | 59 |
| Vietnam | 57 |
| Ethiopia | 52 |
| Philippines | 52 |
| Uganda | 51 |
| Bangladesh | 50 |
| Kenya | 50 |
| Pakistan | 50 |
| Senegal | 45 |
| Zimbabwe | 40 |
| Nigeria | 39 |
| DRC | 35 |
These 29 countries represent more than 2.2 billion people (28% of global total), more than 1.3 million COVID-19 cases (41%) and more than 78,000 COVID-19 deaths (33%) as of 1 May 2020. The preparedness levels of these 29 countries vary greatly. They can also be categorized into three groups and colors. These include green for better prepared (80 or higher), yellow for work to do (40-79), and red for not ready (39 or less). Note that there is an overrepresentation of green countries and underrepresentation of red countries in the 29 countries selected because of their respective high and low availability of COVID-19 testing data.
We then charted some key indicators by ReadyScore country to better describe the data. These are simple correlations of national-level data, subject to the typical limitations of using this type of data. It is important to note that national level measures do not capture important sub-national trends.
ReadyScore and age
Assumption: Countries with higher preparedness scores have an older population, since they also have higher incomes and greater-resourced health systems.
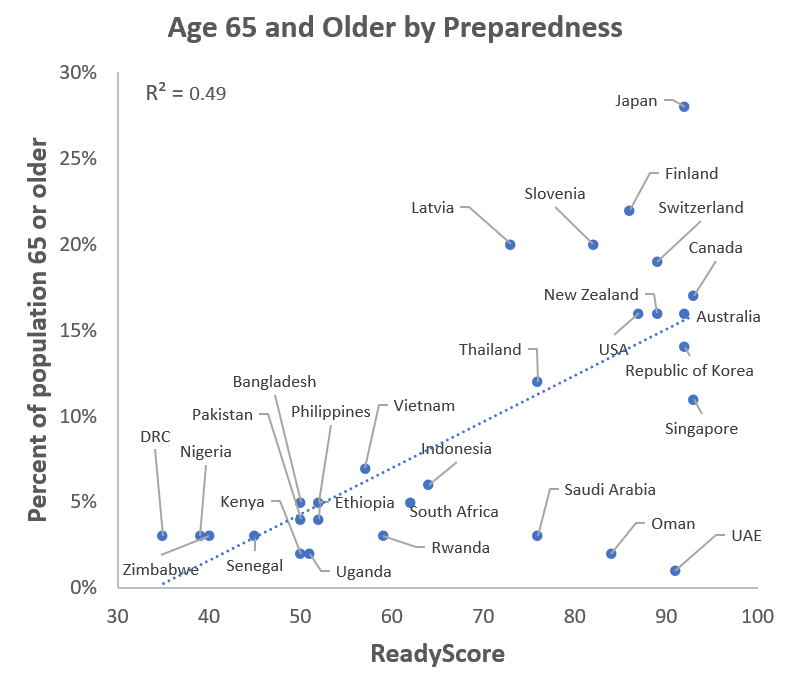
What the chart shows: More prepared countries tend to have older populations. This is important to note since age is the most important risk factor for severe COVID-19 disease including death. We would expect that countries that are more prepared would have higher overall mortality rates, all other things being equal. Outliers from this trend include high-income countries in the Middle East, and Japan and some other high-income countries which have a high proportion older people.
ReadyScore and testing
Assumption: Countries with higher preparedness scores would also be expected to have more testing, since they are more likely to have robust laboratory networks, resources to procure test kits, and trained staff to administer and process tests.
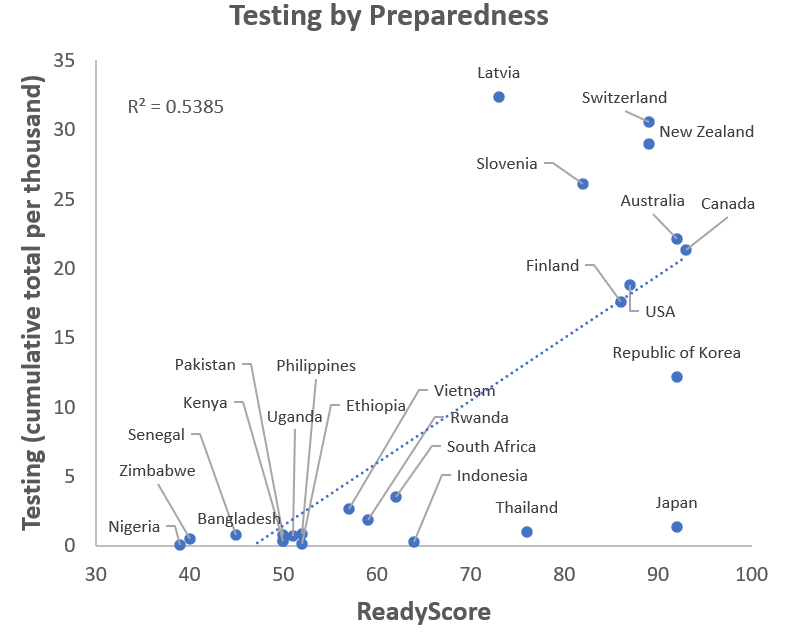
What the chart shows: Comparing overall tests done per thousand through 1 May 2020 with ReadyScore, we see that countries that are better prepared have done more testing per capita. Some countries, such as Japan and Thailand, do not have the magnitude of testing one might expect based on their preparedness score. It is important to note that the number of tests needed depends on the size of the outbreak and the control strategy in place.
ReadyScore and lag-adjusted case-fatality rate (LA-CFR)
Assumption: As discussed earlier, CFR is affected by many determinants (including age) but generally improves (goes down) if there is robust testing and good case management. Unfortunately, data is not available across all countries to adjust CFR for age. Still, one would expect that LA-CFR would be lower for better prepared countries, as they have more robust testing, better equipped health care facilities, and trained staff to take care of severely ill patients.
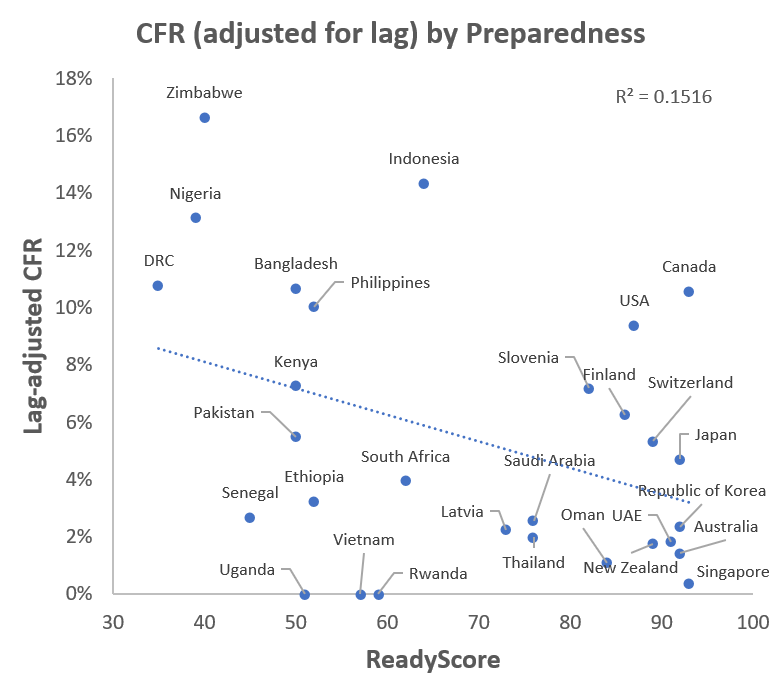
What the chart shows: Looking at LA-CFR by ReadyScore, we can see that better prepared countries do have lower LA-CFRs. Some of the best prepared countries such as the United States and Canada still have LA-CFRs near 10%. Examining LA-CFRs over time would also be useful to see if there is a decline as clinical care and treatment options improve.
Given the importance of age on clinical severity, we can examine the LA-CFR by age and ReadyScore. We would expect that better-prepared countries would have equal of lower LA-CFRs despite having an older population if they are managing cases early and effectively.

What the chart shows: We do not see a clear association between age and LA-CFR, in part because countries with older populations are also better prepared (green dots = ReadyScore 80 or higher). This indicates that these countries have managed to keep their mortality down despite have a much older population.
Ready score and case-PHSM interval
Assumption: Better prepared countries act sooner to protect their populations as indicated by a lower or negative interval (which indicates that the first PHSM was implemented before the first case).

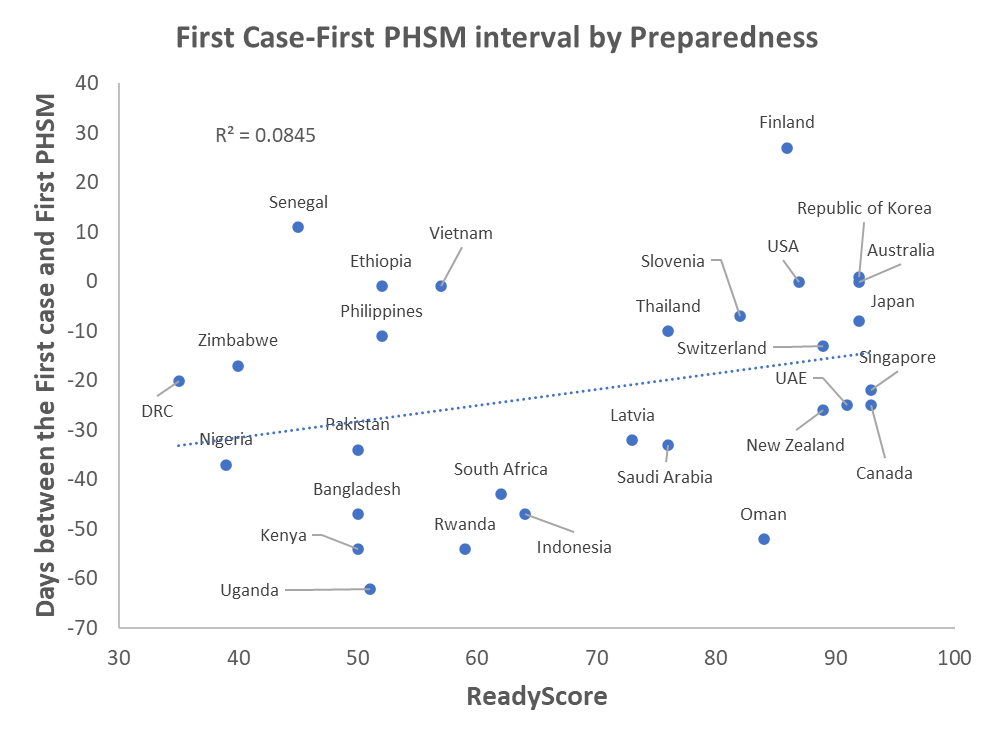
Figure: Map of First Case-First PHSM interval
What the charts show: Better prepared countries did not implement PHSMs sooner than other countries, in comparison to when they had their first case. Several factors should be considered to understand this chart. One is that the amount of advance notice a country had varies significantly. For example, some Asian countries such as Japan, Singapore and South Korea did not have as much time to put PHSMs in place before they detected their first case. In contrast, many South American and African countries implemented PHSMs over a month before their first case, because they monitored the global situation and reacted to prevent early spread. To better understand this relationship, one must consider the types of and adherence to PHSMs that have been implemented.
Summary
Some key observations can be made when examining the relationship between preparedness and some key COVID-19 indicators. Better prepared countries tended to be older and test more of their population. They also had higher CFRs, but lower than expected given the proportion of older people in their populations. This indicates that countries that are better prepared do a better job finding cases and preventing deaths. Better prepared countries did not act sooner to implement PHSMs, and more information is needed to better understand this relationship at country level, including other factors that influenced decision-making.